Del Mar Photonics
Featured customer: Francisco Bezanilla
Research Interests:
Biophysics of excitation: Structure-function in voltage-dependent ionic
channels.
The interest in the lab is the search for the molecular basis of the voltage
sensor operation in voltage dependent channels and the molecular basis of
nervous system adaptation. The molecular basis of excitability is being
approached with physical techniques such as temperature effects and complex
capacitance measurements in the frequency domain in engineered channel molecules
and assessed by gating currents, macroscopic currents and single channel
recordings. The correlation with structural changes are being monitored with
optical fluorescence techniques from probes attached to strategic sites in the
channel molecule to determine light intensity changes and measuring
intramolecular distances with fluorescence resonance energy transfer. The
adaptation is studied as a correlation of RNA editing in membrane proteins and
their physiological consequences in related species living in different
environments.
Cell signaling provides two important aspects of complex cellular functions: intercellular communication (such as transmitter secretion); coordination of intracellular events (such as protein biosynthesis). Electrical and biochemical signals provide the means for both coordinating bodily functions and responding to changes in a cell’s microenvironment. Breakdown in cell signaling often leads to abnormalities such as cancer, heart disease, diabetes, and neurological disorders. Understanding mechanisms of cell signaling will provide us with the critical information required to develop targeted treatments for these types of diseases. Cell signaling is studied using a wide variety of techniques including pharmacology, biochemistry, biophysics, molecular biology, and proteomics.
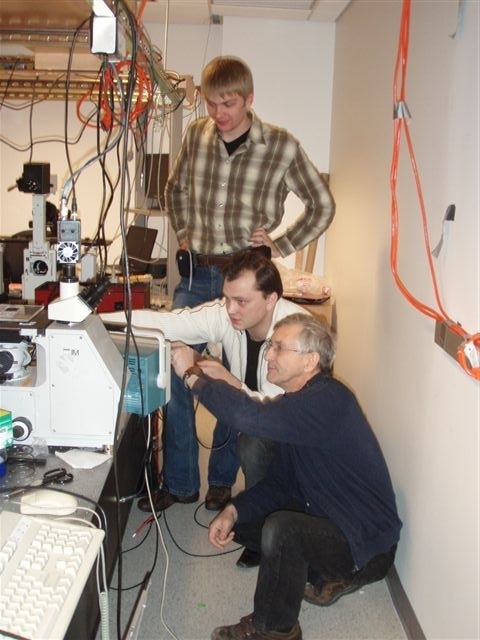
Francisco Bezanilla uses Del Mar Photonics THG generator and Pismo pulse picker in his experiments on measuring intramolecular distances with fluorescence resonance energy transfer (FRET).
Representative Publications:
Chanda, B., Asamoah, OK, Blunck, R., Roux. B., Bezanilla, F. (2005). Gating
charge displacement in voltage-gated ion channels involves limited transmembrane
movement. Nature. 436(7052):852-856.
Blunck, R., Starace, DM., Correa, AM., Bezanilla, F. (2004). Detecting
rearrangements of shaker and NaChBac in real-time with flourescence spectroscopy
in patch-clamped mammalian cells. Biophys J. 86(6):3966-3980.
Chanda, B., Asamoah, OK., Bezanilla, F. (2004). Coupling interactions between
voltage sensors of the sodium channel as revealed by site-specific measurements.
J Gen Physiol. 123(3):217-230.
Physiological Reviews, Vol. 80, No. 2, April 2000, pp.
555-592
Copyright ©2000 by the American Physiological Society
Departments of Physiology and Anesthesiology, University of California at Los Angeles, School of Medicine, Los Angeles, California
I. INTRODUCTION
A. The Pore and the Voltage Sensor
II. THEORETICAL BACKGROUND
A. Electric Charge Movement Reflects the Operation of the Sensor
B. Coupling Energetics of the Sensor and the Pore
C. Gating Charge of One Channel
III. OPERATION OF THE SENSOR
A. Gating Currents Reveal Details of the Activation Pathway
B. Origin of Gating Currents
C. Gating Events at the Single-Channel Level
D. Macroscopic Gating Currents
E. High Bandwidth Reveals New Features of Gating Currents
F. Gating Currents as a Brownian Motion of Charge
G. Gating Currents and Channel Conduction
H. Inactivation of the Conductance
I. Kinetic Models of Channel Operation
IV. MOLECULAR BASIS OF THE VOLTAGE SENSOR
A. Locating the Structures Responsible for Fast Inactivation
B. Locating the Structures Responsible for Voltage Sensing
C. State-Dependent Exposure of Sensor Residues
D. Conformational Changes Detected by Site-Directed Fluorescence Labeling
E. Distance Measurements in the Channel Using Fluorescence Resonance Energy Transfer and Lanthanide-Based Resonance Energy Transfer
V. STRUCTURAL CHANGES AND MODELS OF ACTIVATION
A. Voltage Sensor: a Model of Operation
B. Concluding Remarks
| |
ABSTRACT |
|---|
|
|
|---|
Bezanilla, Francisco The Voltage Sensor in Voltage-Dependent
Ion Channels. Physiol. Rev. 80: 555-592, 2000.![]() In
voltage-dependent Na, K, or Ca channels, the probability of opening is modified
by the membrane potential. This is achieved through a voltage sensor
that detects the voltage and transfers its energy to the pore to
control its gate. We present here the theoretical basis of the energy
coupling between the electric field and the voltage, which allows the
interpretation of the gating charge that moves in one channel.
Movement of the gating charge constitutes the gating current. The
properties are described, along with macroscopic data and gating
current noise analysis, in relation to the operation of the voltage
sensor and the opening of the channel. Structural details of the
voltage sensor operation were resolved initially by locating the
residues that make up the voltage sensor using mutagenesis
experiments and determining the number of charges per channel. The
changes in conformation are then analyzed based on the differential
exposure of cysteine or histidine-substituted residues. Site-directed
fluorescence labeling is then analyzed as another powerful indicator
of conformational changes that allows time and voltage correlation of
local changes seen by the fluorophores with the global change seen by
the electrophysiology of gating currents and ionic currents. Finally,
we describe the novel results on lanthanide-based resonance energy
transfer that show small distance changes between residues in the
channel molecule. All of the electrophysiological and the structural
information are finally summarized in a physical model of a
voltage-dependent channel in which a change in membrane potential
causes rotation of the S4 segment that changes the exposure of the
basic residues from an internally connected aqueous crevice at
hyperpolarized potentials to an externally connected aqueous crevice
at depolarized potentials.
In
voltage-dependent Na, K, or Ca channels, the probability of opening is modified
by the membrane potential. This is achieved through a voltage sensor
that detects the voltage and transfers its energy to the pore to
control its gate. We present here the theoretical basis of the energy
coupling between the electric field and the voltage, which allows the
interpretation of the gating charge that moves in one channel.
Movement of the gating charge constitutes the gating current. The
properties are described, along with macroscopic data and gating
current noise analysis, in relation to the operation of the voltage
sensor and the opening of the channel. Structural details of the
voltage sensor operation were resolved initially by locating the
residues that make up the voltage sensor using mutagenesis
experiments and determining the number of charges per channel. The
changes in conformation are then analyzed based on the differential
exposure of cysteine or histidine-substituted residues. Site-directed
fluorescence labeling is then analyzed as another powerful indicator
of conformational changes that allows time and voltage correlation of
local changes seen by the fluorophores with the global change seen by
the electrophysiology of gating currents and ionic currents. Finally,
we describe the novel results on lanthanide-based resonance energy
transfer that show small distance changes between residues in the
channel molecule. All of the electrophysiological and the structural
information are finally summarized in a physical model of a
voltage-dependent channel in which a change in membrane potential
causes rotation of the S4 segment that changes the exposure of the
basic residues from an internally connected aqueous crevice at
hyperpolarized potentials to an externally connected aqueous crevice
at depolarized potentials.
| |
I. INTRODUCTION |
|---|
|
|
|---|
The remarkable work of Hodgkin and Huxley (39) set the physical basis of the nerve impulse generation and propagation using the giant axon of the squid as a model. In their description, the initiation and conduction of the action potential is the result of a transient influx of Na ions that is followed and overlapped by an outflux of K ions across the axon membrane. Their voltage-clamp studies revealed that the ion flow through these two specialized pathways occurs with distinctive kinetics and that the conductance of these pathways is voltage dependent. The voltage dependence of the conductances is the basis of the generation of the impulse, and it was later found that other selective pathways, such as Ca conductances, can also generate similar transient voltage changes. In the discussion of the origin of the voltage dependence of the conductances, Hodgkin and Huxley (39) noticed that there was no detectable outward current flux preceding the inward Na current. This was the basis of their hypothesis whereby the large flow of ions through the conductive pathway is gated by the position of only a few charged particles whose distribution is modified by the membrane potential. This visionary hypothesis implied the existence of a large number of conducting units, each modulated by voltage through the operation of a voltage sensor. This is the unit that today we call the voltage-dependent ion channel, which is gated open and closed depending on the position of charged groups that move in response to changes in the membrane potential.
Ion channels are specialized proteins embedded in the membrane. The ion selectivity of the channel is a property associated with its permeation pathway, normally called the pore. The magnitude of the current across the membrane depends on the density of channels, the conductance of the open channel, and how often the channel spends in its open position or its open probability. The salient feature of channels involved in excitable membranes is that the open probability is regulated by the transmembrane voltage or membrane potential. After the work of Hodgkin and Huxley (39), the tools of electrophysiology, molecular biology, X-ray crystallography, and optics have advanced significantly our knowledge on the operation of the pore and the voltage sensor.
This review focuses on the properties, operation, and molecular aspects of the voltage sensor. The gating charge movement is a direct measurement of the voltage sensor operation, and our main interest is to determine how this charge movement is coupled to the opening of the pore. Therefore, in section II we first develop the theoretical basis of how the voltage sensor is energetically coupled to gate the pore open or closed. From this treatment we get the basis of methods to estimate the electric charge moved by the sensor in each channel, or charge per channel. This is a fundamental property of the sensor because it determines the voltage dependence of the channel and it constrains physical models of charge translocation in the channel protein. Section III develops the operation of the sensor as seen by detection of electrical signals such as macroscopic ionic and gating currents as well as single-channel recordings and fluctuation analysis of gating current noise. Section IV addresses how the experimental results on the molecular aspects of the channel structure can explain the operation of the sensor. Section V summarizes the main aspects of the operation and molecular structure of the voltage sensor and its coupling to the pore with a model that accomodates existing data.
A. The Pore and the Voltage Sensor
In general, the macroscopic ionic current (Ii) is given by
|
|
(1) |
where V is membrane potential; N is the total number of
channels;
![]() (V)
is the conductance of the open pore, which is a function of voltage;
Po(V) is the probability that the pore is open, also
a function of voltage; and Ve is the reversal potential
of the ionic current through the pore. The voltage dependence of the
ionic current in ion channels is not a property of the conducting
pore. This is because, in general, the conductance of one open
channel,
(V)
is the conductance of the open pore, which is a function of voltage;
Po(V) is the probability that the pore is open, also
a function of voltage; and Ve is the reversal potential
of the ionic current through the pore. The voltage dependence of the
ionic current in ion channels is not a property of the conducting
pore. This is because, in general, the conductance of one open
channel,
![]() (V),
is almost constant unless there are extremely asymmetrical ionic
conditions or a voltage-dependent block. Thus the extremely nonlinear
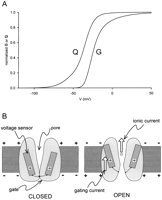
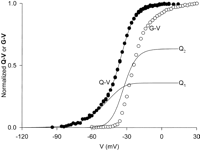
dependence of the macroscopic ionic conductance with voltage (Fig.
1A) is the result of the modulation of the open
probability (Po) of the channel by voltage. This has
been verified by recording single-channel currents and finding that
the measured fractional open times of the channel become negligible
at hyperpolarized potentials while it approaches unity at depolarized
potentials. This means that to understand voltage-dependent channels
we must find the mechanism by which the voltage can modulate the
probability that the channel is open.
(V),
is almost constant unless there are extremely asymmetrical ionic
conditions or a voltage-dependent block. Thus the extremely nonlinear
dependence of the macroscopic ionic conductance with voltage (Fig.
1A) is the result of the modulation of the open
probability (Po) of the channel by voltage. This has
been verified by recording single-channel currents and finding that
the measured fractional open times of the channel become negligible
at hyperpolarized potentials while it approaches unity at depolarized
potentials. This means that to understand voltage-dependent channels
we must find the mechanism by which the voltage can modulate the
probability that the channel is open.
|
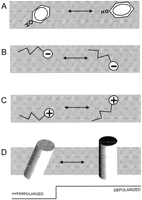
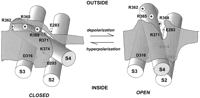
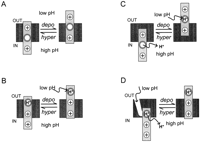
Functionally, we can distinguish three basic structures in voltage-dependent channels. First, there must be a device that detects the voltage across the membrane, then this device must communicate this information to the pore to change the frequency at which the gate of the channel opens or closes (Fig. 1B). The detecting device has been called the voltage sensor. How can the sensor detect the membrane potential? An electric field can be measured by an electric charge position or by an electric dipole orientation, and we might envision a similar mechanism in the channel molecule. Then, a possible mechanism is that a change in the membrane potential results in a reorientation of dipoles or an actual charge movement within the membrane field that would produce a conformational change in the channel molecule, which in turn would result in favoring the open or closed state of the pore. The experimental evidence provided by site-directed mutagenesis combined with electrophysiology has given a solid basis to this basic mechanism.
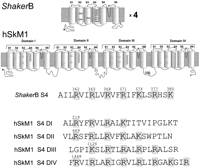
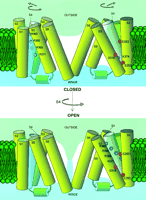
Voltage-dependent channels such as Na, K, and Ca channels have a common structure with 24 transmembrane segments and a specialized pore region (Fig. 2). Potassium channels are made of four subunits, each containing six transmembrane segments plus a pore loop between the fifth and sixth transmembrane segments (Fig. 2, top). In contrast, the main molecule of the Na and Ca channels is one large subunit that contains four homologous domains, each with six transmembrane segments and a pore loop (Fig. 2, middle). Within this common structure, the pore is formed by the pore loops plus a contribution of the sixth transmembrane segments of the four subunits (or domains). The view of the pore has been beautifully clarified by the crystal structure of KcSa bacterial K channel (32). This channel is a member of a family of two transmembrane segment subunit channels. However, MacKinnon et al. (56) have shown that segments S5, S6, and the pore loop of the voltage-dependent Shaker K channel has close homology to the KcSa channel. We can hypothesize that the pore of voltage-dependent channels is similar to the pore structure of KcSa channel and try to build around this structure the unknown contribution and position of segments S1 through S4 (see sect. V).
|
In voltage-dependent channels, the fourth transmembrane segment (S4) contains between four and eight basic residues (arginines or lysines), each separated from the next by two hydrophobic residues (see Fig. 2). Because these residues may be positively charged, the S4 segment was first recognized by Noda et al. (65) as a possible candidate for the voltage sensor. Several investigators tested the S4 voltage sensor hypothesis (52, 54, 70, 100), and indeed, the results suggested but did not prove that the S4 segment was the actual voltage sensor. The experiments examined the effects of neutralization of the basic residues of the S4 segment on the resultant ionic current. With the measurement of ionic currents, it is possible to infer the relative proportion of open channels as a function of the membrane potential, which is equivalent to the relative open probability (Por). Two basic parameters can be measured from the voltage dependence of the Por: the midpoint of the Por and the steepness of the Por with voltage. In a two-state channel, these parameters would be enough to fully characterize the channel, but if there are more states, some extra information is required, as we will see below. The displacement of the midpoint Por in the voltage axis could be the result of stabilization of the open or closed states without involvement in the number of charges of the sensor. The steepness of a Boltzmann fit to the conductance versus voltage curve reflects the number of charges involved in voltage sensing, but it only can be interpreted unequivocally in two-state channels. As the Na and K channels have many more than two states, Boltzmann fits of the ionic conductance after neutralizing a suspected basic residue in the S4 segment were not enough to prove the involvement of that residue in voltage sensing. The limiting slope method, which is also computed from ionic currents, could be used to estimate the actual charges involved in gating, but its application is limited by theoretical and experimental constraints, as we will see in section IIC.
To determine the contribution of a particular charge to voltage sensing, it is necessary to count the charges moved per conducting channel. If the neutralization of a particular charge results in a decrease of the total number of charges per channel, it must be proven further that the charge movement was energetically coupled to channel opening, as is discussed in section IIB.
| |
II. THEORETICAL BACKGROUND |
|---|
|
|
|---|
A. Electric Charge Movement Reflects the Operation of the Sensor
Regardless of the type of electric sensor, a free charge moving in the field or a dipole reorientation as a consequence of changing the membrane potential is translated in the external circuit as a transient electric current. The current is transient because the charge or dipole reorientation will cease at long times when it reaches its new equilibrium position. Because this current is responsible for the change in Po of the channel, it has been called gating current. Gating currents were predicted by Hodgkin and Huxley (
39) and were first recorded in skeletal muscle by Schneider and Chandler (78) and squid axon by Armstrong and Bezanilla (6) and Keynes and Rojas (45). These small currents were visible using signal-averaging techniques after blocking the bulk of the ionic currents and using a subtraction procedure to eliminate the linear capacity current. With the advent of heterologous expression, a large density of Shaker K channels has been obtained on the plasma membrane of Xenopus oocytes. This large number of channels combined with the ability to make the channel nonconducting (73) has made possible the recording of gating currents in single trials without subtraction (99), where most of the membrane transient current recorded is gating current. The time integral of the gating current at a particular voltage V1 is called the gating charge or Q(V1). The full functional dependence of the charge with voltage Q(V) (or Q-V curve, Fig. 1A) shows a sigmoid shape with asymptotes at extreme potentials because at those voltages the charge has moved to its extreme position. It is important to note that the measured gating charge may correspond to a displacement of a charge within a certain fraction of the total field or the change of orientation of a dipole in that field because an electrical measurement of the gating current will not distinguish between dipoles and free charges. In fact, it is easy to see that it does not discriminate between positive and negative charges or distinguish how far the charge moves within the field, because the total displacement measured is the product of the absolute value of the charge times the fraction of the field it traverses. In a general case, assume that we have i elementary electronic charges e0 of valence zi moving a fraction of the field|
|
(2) |
Therefore, in our discussion of electrical measurements of gating charge, we refer to the charge q as the product of the charge moved times the fraction of the field. Notice that in this view the sensor could also operate by changing the field without moving the charge in question, and for this reason, the voltage sensor must be considered the ensemble of charges and/or dipoles together with the electric field where they are embedded.
B. Coupling Energetics of the Sensor and the Pore
Because the voltage sensor operation is reflected in charge movement, we address the coupling of the sensor with the pore by developing a general relation between charge movement and pore opening. To make this relation as general as possible, we consider the system in thermodynamic equilibrium where the physical states of the channel molecule obey the Boltzmann distribution.
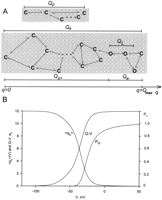
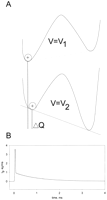
Consider a general case of a channel that has a multitude of states, where some are closed states and others are states where the pore is open. We can represent the physical states of this channel in a diagram such as in Figure
3A, where each of the states will have associated an energy or potential of mean force F. Because our measured variable is the charge displaced q, we can associate each state with a particular value of q and thus use it as the reaction coordinate (axis of Fig. 3A). After a sudden change in membrane potential V, the occupancy of each of the states will be redistributed according to the new energy profile attained by the modification of V. The connection between states is totally general, such that some states may be connected to all of the others or to only a few. However, we distinguish the case of states that are connected from the ones that are disconnected from the ensemble of states that lead to the open state because the latter ones are not energetically coupled to channel operation. Then we define two types of charge: essential charge Qe, which is energetically coupled to channel opening, and peripheral charge Qp, which has no connection to pore function.
|
To solve the relation between charge movement and channel opening, we now are
set to find how the voltage dependence of charge movement relates to
the voltage dependence of the Po in thermodynamic
equilibrium. This question was recently solved by Sigg and Bezanilla
(84) for the general case pictured in Figure 3A,
including the case of a continuous density of states. The basic
assumption in that derivation is that the potential of mean force Fi
in each state i is a linear function of the applied membrane
voltage V and is given by
|
|
(3) |
where Gi is the potential of mean force of state i in the absence of membrane voltage and qi represents the charge of that particular state. We must remember that qi is the product of the charge times the fraction of the field and that we will only consider the essential charge (q = Qe).
To proceed, we will define a measure of the electrical energy required to
activate or open the channel, which is quantified by the Po.
This we call the activation potential Wa and is defined
in a similar fashion as the chemical potential is defined
|
|
(4) |
where k is the Boltzmann constant and T is absolute
temperature. Because Wa is an electrical energy, it will be
the product of the membrane voltage and the activation charge moved.
We then define the mean activation charge <qa>(V)
as the negative gradient of the activation potential Wa
|
|
(5) |
By combining Equations 3 and 5
and the expression of the mean open probability Po obtained
from the Boltzmann distribution of each of the states, we obtain the
final result (84)
|
|
(6) |
where Qmax is the total charge movement, Q(V)
is the charge versus voltage curve (or Q-V curve), and <qL>
is the mean latent charge defined as
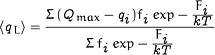
|
(7) |
where fi is the fractional value of the maximum conductance of conducting state i and qi is the charge associated with that state. Notice that the value of <qL> is a weighted average value computed over all the conducting states where the weighting factor is a charge that has the origin at the maximum value of q = Qmax. Then, if the open states occur all at q = Qmax, the value of <qL> is zero.
Equation 6 is the general relation between the
voltage dependence of the logarithm of the Po and the voltage
dependence of the charge movement independent of the kinetic model
representing the channel. The interpretation of this relation is as
follows. For a channel that activates with depolarization, when the
membrane potential is made very negative, the limiting activation
charge, <qa>(V
![]()
![]()
![]() ),
is the total charge required to open the channel, excluding <qL>
which is related to the charge moving between open states (a change
of sign makes the derivation applicable for a channel that activates
upon hyperpolarization).
),
is the total charge required to open the channel, excluding <qL>
which is related to the charge moving between open states (a change
of sign makes the derivation applicable for a channel that activates
upon hyperpolarization).
We may consider two general classes of voltage-dependent channels that are contained by the general derivation presented, including Equations 6 and 7. The first type has strict coupling between the charge and the opening of the pore, such that there is no pore opening unless the charge has moved, and vice versa. In Figure 1B, this type of channel would be represented when the link joining the voltage sensor and the gate is rigid. In this type of channel, the first open state must occur at q > 0 in the diagram of Figure 3A. The second type of channel has loose coupling between the voltage sensor and the opening of the pore, such that it is possible to open the gate even when no charge has moved. This type of channel would be represented in Figure 1B with a loose link between the sensor and the gate, and in the diagram of Figure 3A, the first open state would be located at q = 0 and not depicted in the figure.
If we consider the special case when there is no charge movement between open
states (<qL> = 0), then
|
|
(8) |
This is the basis of the limiting slope method used to determine the total charge involved in channel activation. An illustration of the relation between <qa>, Q(V) (or Q-V), and Po is shown in Figure 3B for a case without mean latent charge (<qL> = 0); it can be seen that <qa> is Qmax plus the inverted value of Q(V). A linear sequential model ending in one open state is a special case of this result and was derived originally by Almers (5).
Note that the charge per channel obtained with the limiting slope procedure will reflect the correct total activation charge only if there is no mean latent charge. It is still possible to obtain the correct value in a channel with multiple open states provided there is no charge movement between those states. However, one of the most serious difficulties of the limiting slope method is to determine <qa>(V) at very negative potentials because Po becomes too small to measure it accurately. One possibility is to estimate <qa>(V) with single-channel measurements at those potentials where Po is very small (38). Another method is to use the Q(V) relation (Q-V curve) that can be determined accurately to potentials at which Po is negligible. In this method, it is possible to determine Qmax, the total charge per channel using Equation 6, a method we may call modified limiting slope. In that case, when the negative value of Q-V curve is shifted by Qmax, the result will superimpose on <qa> after appropriate scaling (83). The scaling is valid because dln(cPo)/dV = dlnPo/dV, where c is an arbitrary constant. If the channel moves charge between the open states, we must use Equation 6, but it becomes difficult to determine the value of Qmax.
The derivation summarized above gives us a procedure to determine Qmax, the total charge per channel directly involved in channel activation. Knowing how much charge is necessary for channel gating is the first step in determining the physical basis of this charge in the general structure or in specific residues of the channel molecule.
C. Gating Charge of One Channel
The method outlined in section IIB for the case of no charge movement between open states (QL = 0) will determine the essential charge per channel Qe, which will be equal to Qmax. This determination will be difficult when QL does not equal zero; therefore, a simple alternative procedure may be used. With the measurement of the total gating charge Qtot in a cell membrane and the knowledge of how many channels N are present, it is possible to determine the charge per channel as Qtot/N. This method, however, will include peripheral charge (Qp) that is not energetically coupled to channel gating because Qtot = Qe + Qp. The total charge can be easily measured by taking the difference between the two asymptotic values of the Q-V curve, which is obtained by integration of gating currents. Alternatively, integrating all the capacity transient at each potential, one can obtain the total charge that includes the charge of the membrane capacity (linear with voltage) and the gating charge. In this case, linear charge is subtracted by fitting the linear increase from the charge versus potential curve (
1). Then, in the same area of membrane, N can be determined by counting the channels using a toxin that specifically binds with a one to one ratio to the channel (1, 50). If the area is small, then the number of channels may also be estimated using noise analysis of the ionic currents (88), and after blocking the ionic currents, the total charge is determined by measuring gating currents (79, 83).The first accurate determination of total charge per channel was done by
Schoppa et al. (79) using a combination of noise
analysis and gating currents in patches expressing fast inactivation-removed
Shaker K channel (we call this channel Shaker-IR). The value
was between 12 and 13 e0, a value larger than
suspected from previous estimates done by fitting models to the
macroscopic ionic currents (116) and larger than
the value of 9.5 e0 obtained with limiting slope
determinations by the same authors (79). However, those
limiting slope measurements were not done at sufficiently negative
membrane potentials and may have missed some of the charge. This
was confirmed by Noceti et al. (64) and Seoh et al. (83).
Seoh et al. (83) measured the same value of charge
using the Q/N method and the modified limiting slope
method in the wild-type Shaker-IR. This result demonstrated
that all the gating charge measured in Shaker K channel is
essential, that is, energetically coupled to channel opening, and
that there is no charge movement in parallel. In the case of the
skeletal muscle Na channel, Hirschberg et al. (38)
used single-channel measurements to estimate the limiting slope at
very low probability and found a similar value of 12 e0.
Noceti et al. (64) studied the charge per channel
of neuronal and cardiac Ca channels in presence and absence of
![]() -subunits.
Their limiting slope result indicates a value of 8.6 e0
regardless of the presence or absence of
-subunits.
Their limiting slope result indicates a value of 8.6 e0
regardless of the presence or absence of
![]() -subunits.
In contrast, the Q/N method gave normally higher values
and varied depending on the presence of the
-subunits.
In contrast, the Q/N method gave normally higher values
and varied depending on the presence of the
![]() -subunit.
However,
-subunit.
However, ![]() 1E
1E![]() 2a,
which had the maximum Po, gave a charge per channel
similar to the limiting slope method using the Q/N
method. They concluded that the correct value was the limiting slope
result and that the higher charge per channel obtained with the Q/N
method was the result of null events (low Po) that
produced an artificially low channel count.
2a,
which had the maximum Po, gave a charge per channel
similar to the limiting slope method using the Q/N
method. They concluded that the correct value was the limiting slope
result and that the higher charge per channel obtained with the Q/N
method was the result of null events (low Po) that
produced an artificially low channel count.
| |
III. OPERATION OF THE SENSOR |
|---|
|
|
|---|
At the normal resting potential of the cell (ca.
![]() 70 mV,
negative inside), most of the voltage-dependent Na, K, and Ca channels
are normally closed. A sudden change of the membrane potential
to more positive values (depolarization) increases or activates the
conductance, and this activation becomes faster as the depolarization
is made larger. Some channels (Na, Ca, and some K channels) will show
a subsequent decrease of the conductance while the membrane is
maintained depolarized, a phenomenon called inactivation. Upon sudden
repolarization, channels will deactivate, reverting to their resting
closed state.
70 mV,
negative inside), most of the voltage-dependent Na, K, and Ca channels
are normally closed. A sudden change of the membrane potential
to more positive values (depolarization) increases or activates the
conductance, and this activation becomes faster as the depolarization
is made larger. Some channels (Na, Ca, and some K channels) will show
a subsequent decrease of the conductance while the membrane is
maintained depolarized, a phenomenon called inactivation. Upon sudden
repolarization, channels will deactivate, reverting to their resting
closed state.
A salient feature of the activation of conductance is its sigmoidal time course, which indicates that the channel evolves through many closed states before reaching the conducting state. One of the earliest demonstrations of multiple closed states was provided by Cole and Moore (27) using negative conditioning prepulses. They found that as the conditioning potential was made more negative, a larger delay was observed in the turn-on of the K current, consistent with the idea that negative potentials favor the closed states further away from the open state. In contrast to activation, the deactivation of the conductance is a simple process that normally does not show a delay, indicating that conduction stops when the channels leave the open state.
Until the early 1970s, the details of activation, inactivation, and deactivation were inferred only from macroscopic ionic currents, and several kinetic models of channel operation were advanced. Except for the initial delay in activation and the Cole-Moore shift, ionic currents are not expected to give a detailed account of the events preceding the opening of the channel because they only show the open state of the channel. The recording of single-channel events (63) opened the possibility of studying the operation of one channel in isolation and thus infer its statistical properties with higher accuracy than macroscopic ionic currents. However, single channels only report the open state and therefore are quite insensitive to the kinetic details of the channel operation in states far removed from the open state. The recording of gating currents opened the possibility of studying more directly some of the transitions between closed states, in addition to the transitions leading to the open states of the channel. This is because gating currents are proportional to the rate of charge movement of all the transitions that carry charge in the activation pathway (see sect. IIIB), including those that are far removed from the open states and that are practically invisible in macroscopic ionic currents and single-channel recordings. Thus, because each one of the electrophysiological types of recording has different sensitivities to the transitions of the activation pathway, ideally a detailed model of channel operation must be built on the basis of gating currents as well as single-channel and macroscopic current recordings (81, 108, 119).
A. Gating Currents Reveal Details of the Activation Pathway
Gating currents are transient currents because they represent the movement of charge trapped in the membrane electric field. They are normally a small fraction of the ionic currents because the equivalent of only ~10 electronic charges are needed to open a channel that can carry 107 ions/s. The amplitude of the gating currents will be smaller as the kinetics of charge movement become slower. For example, at 0 mV, peak gating current is ~1/50 of the ionic current in squid Na channel and ~1/200 of the ionic current in Shaker K channel. These considerations set the stage for the requirements in recording gating currents. In preparations such as the squid axon, ionic currents were eliminated by substituting all ions by impermeant species, leaving only a time-independent leak and the capacity transient current needed to charge the membrane capacitance. The gating current can be extracted from this remaining current by subtraction of the linear capacity transient using voltage pulses in the region of voltage where the gating charge is not moving (
6). The slower K channel gating current could be measured by increasing the temperature to speed up the gating kinetics (16). The separation of gating currents from different channels relies on pulse protocols, temperature changes, and pharmacology. Quantitative studies of gating currents are limited to channels that have predominant gating currents over the other channels in the same preparation.With the advent of molecular cloning, many of the difficulties in recording gating currents were eliminated. Heterologous expression allows the recording of channel activity in virtual isolation, allowing a detailed description of gating currents properties (e.g., Refs. 12, 28). Some channels can be expressed at very high densities. For example, ~1010 Shaker K channels can be expressed in one oocyte which gives 3,000 channels/µm2, which is 10 times larger than the K channel density in the squid axon. (The density per actual membrane area is 9 times less, as estimated by membrane capacitance.) This high density allows the visualization of gating currents even before subtraction of the capacity transient because the capacitance due to gating can be 10 times larger than the oocyte capacitance (99). Perhaps one of the most interesting capabilities of heterologous expression of channels is the possibility of introducing mutations to test the function of a particular residue or a region in the channel molecule or to introduce a marker that can be traced chemically or optically. For example, a mutation in the pore region of the Shaker K channel (W434F) eliminates ion conduction but keeps the gating process essentially unaffected (73, but see sect. IIIG), allowing the recording of gating currents in the presence of permeant ions (99).
B. Origin of Gating Currents
As explained in section IIA, voltage dependence results from the repositioning of the charge in the membrane field. The channel will have a higher Po when enough charge has moved into the correct position to favor the open state. Considering a large number of channels, if we start at hyperpolarized potentials and apply a depolarizing pulse, charge will move in the field and an electric current will be recorded in the external circuit. Because the charge will eventually attain its equilibrium state, the current will be transient in nature. When the membrane potential is returned to its original value, the charge will move back, possibly with a different time course, but the time integral of this off-gating current must match the area during the on phase of the gating current. The time course of the current during the on or off phase reflects the kinetics of the charge movement as a result of the change in potential.
A gating current Iij will occur every time a charge moves between two conformational states of the channel Si and Sj according to
|
|
(9) |
where ![]() ij
and
ij
and ![]() ji
represent the elementary forward and backward transition rate constants between
the states, respectively, and zije0
is charge times the fraction of the field moving between the states.
With the assumption that the charge may take many conformational
states, the gating current Ig is the sum of the
contributions of all possible transitions between states
ji
represent the elementary forward and backward transition rate constants between
the states, respectively, and zije0
is charge times the fraction of the field moving between the states.
With the assumption that the charge may take many conformational
states, the gating current Ig is the sum of the
contributions of all possible transitions between states
|
|
(10) |
The rate constants will depend on the height of the energy barrier Fij
separating the states so they have the general form
|
|
(11) |
where ![]() ij*
is a constant. Assuming that the electric energy of the charge is linearly
dependent on the voltage as was done for the equilibrium (see Eq. 3),
we separate the total energy into electric energy and all others as Fij = Gijc
ij*
is a constant. Assuming that the electric energy of the charge is linearly
dependent on the voltage as was done for the equilibrium (see Eq. 3),
we separate the total energy into electric energy and all others as Fij = Gijc ![]() z
z![]() ije0V
and Fji = Gjic
ije0V
and Fji = Gjic ![]() z
z![]() jie0V
with
jie0V
with ![]() ij +
ij + ![]() ji = 1. We
can write the voltage dependence of the rates as
ji = 1. We
can write the voltage dependence of the rates as
|
|
(12) |
|
|
(13) |
with ![]() ij0
and
ij0
and ![]() ji0
as the rates in the absence of electric field. This simple formulation predicts
that forward rates will increase with depolarization and backard
rates will increase with hyperpolarization. The actual time course of
the gating current will be given by the solution of the state
equations, which will give a sum of exponentials with rate constant (eigenvalues)
containing a combination of the elementary rates
ji0
as the rates in the absence of electric field. This simple formulation predicts
that forward rates will increase with depolarization and backard
rates will increase with hyperpolarization. The actual time course of
the gating current will be given by the solution of the state
equations, which will give a sum of exponentials with rate constant (eigenvalues)
containing a combination of the elementary rates
![]() ij
ij![]() ji
for all i and j values. The kinetic features of gating currents can
be quite complicated (see Fig. 4) and rarely seem
like simple processes.
ji
for all i and j values. The kinetic features of gating currents can
be quite complicated (see Fig. 4) and rarely seem
like simple processes.
|
C. Gating Events at the Single-Channel Level
The basic question is how the current kinetics originate at the molecular or single-channel level. There are two extreme possibilities. The first possibility is that the time course of the gating current results from a continuous movement of charge in each channel with a similar time course of the ensemble gating current. The second possibility is that in each channel the charge moves through discrete, jumplike process that in an ensemble adds up into a continuous decaying current. The second view has been the predominant trend in the literature, and early predictions of a jumplike process (see Fig.
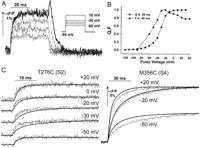
1 in Bezanilla, Ref. 10) were experimentally confirmed in Na channels (28) and K channels (86).The nature of the charge movement at the single-channel level could be resolved if the elementary charge movement were recorded, but it has not been experimentally possible. Instead, the analysis of the fluctuations of the ensemble gating currents (30, 85) has yielded information on the elementary event. Conti and Stuhmer (28) were the first to record gating current fluctuations from a population of Na channels expressed in Xenopus oocytes and found that the elementary event is ~2.3 e0. The time course of the event itself was limited by the filter used, indicating that it was much faster than 5 kHz. The analysis of the autocorrelation showed that these events were consistent with a process that carries discrete packages of charge in the channel (a shotlike process). Sigg et al. (86) studied the fluctuations of gating currents in the Shaker K channel, which has slower kinetics, allowing a larger effective bandwidth. The elementary charge per event was estimated to be 2.4 e0 for large depolarizations. The analysis of fluctuations at moderate depolarizations showed larger fluctuations, as expected from the noise introduced by the discrete charge packages (shot events) that return charge to its resting position. However, at these potentials, the time course of the fluctuations lagged significantly with respect to the ensemble gating current, showing that at small depolarizations most of the gating current produced no detectable fluctuations. This result indicates that the early movement of the charge is not the result of large shots, as is the case for transitions near the open state. Recently, Stefani et al. (98) have extended these measurements to 20-kHz bandwidth, and the elementary event for large depolarizations was confirmed to be 2.4 e0. In this study, the off elementary event was 2.7 e0, consistent with the idea that the large shot event occurs near the open state. In the off gating current, the recorded fluctuations have less contamination from the smaller events that occur in the deeper closed states, and the estimated elementary event should be closer to the true shot size.
The question of whether the large shot of charge is the contribution of each subunit or of several subunits moving in concert is not resolved yet for the Shaker channel. However, the results from the Na channel (28) indicate that the large shot is the contribution of one or at the most two of the four voltage sensors. This is because in that study they found that the size of the shot (2.3 e0) was the same during activation and during the return after a long pulse when the channels were inactivated. Because we know now that two of the subunits do not go back until inactivation is recovered (see sect. IVD and Cha et al., Ref. 21), we must conclude that the 2.3 e0 they determined in the off is not the result of the concerted return of the four domains but at the most two, giving a value of 1.15 to 2.3 e0 per subunit.
D. Macroscopic Gating Currents
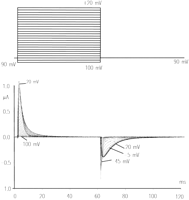
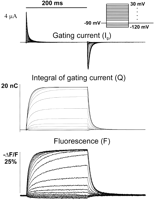
Gating currents from the Shaker K channel recorded with 5-kHz bandwidth show a rising phase followed by a decaying phase (see Fig.
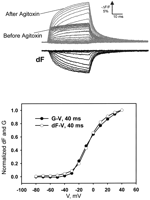
4). The rising phase becomes more pronounced for large depolarizations. The decaying phase show single exponential behavior for small depolarizations, double exponential for intermediate depolarizations, and single exponential for large depolarizations. The first component is faster than the second, but as the potential increases, the second becomes progressively faster to the point that the first is no longer detectable and is replaced by the rising phase. A rising phase in the gating current indicates a sequential set of steps in which the initial steps carry less charge or move more slowly than the following steps (15). A simple interpretation of these results is that the initial transitions are faster and carry less charge than the subsequent transitions so that at small depolarizations the gating current is predominantly given by these transitions. At higher depolarizations, the slower transitions that carry more charge become visible as a second component and at even higher depolarizations become very fast because their charge is larger (see Eq. 12) and predominant while the first transitions produce the rising phase. The charge versus potential (Q-V) curve of this channel (obtained by integration of the gating current traces) also shows two main components called Q1 and Q2 (see Fig. 5 and Bezanilla et al., Ref. 13) when fitted by the sum of two Boltzmann distributions or by a sequential three-state model. In both cases, the fit indicates that the first component is centered toward hyperpolarized potentials with a smaller elementary charge than the second component, which is centered at more depolarized potentials (Fig. 5). A confirmation of two sequential charge movements comes from the differential effects of temperature on the early and late components of the gating currents (76). The Q10 of the early transitions (Q1) is less than 2 whereas in later transitions (Q2) is ~3. In addition, the Cole-Moore shift has a very low temperature dependence (76), and this shift has been traced to charge movement between early closed states of the channel (99, 102).
|
With all these results, it is tempting to propose that the charge in the channel moves in two sequential steps, the first carrying less charge than the second step. However, two steps are not enough to account for the delay in the ionic current turn on (119) and the pronounced Cole-Moore shift of the gating and ionic currents (99). For this reason, models proposed include many more steps in two major classes: a sequential model with an initial set of states with small charge movement between states followed by a large charge movement preceding channel opening (13); or a model with four subunits, each with two transitions (3 states), the first with a large charge movement followed by the second transition with a smaller charge movement. In this second type of model, when all four subunits have reached the third state, the channel undergoes a final transition to the open state strongly biased in the forward direction, introducing cooperativity and explaining the very steep voltage dependence of the Q-V curve at high depolarizations (119). After these two sequential steps, there is at least one more step preceding the channel opening. This extra step(s) has been studied in detail in mutants that change their equilibrium by Schoppa and Sigworth (80) and by Ledwell and Aldrich (48).
The off gating currents recorded from the nonconducting W434F ShakerB (IR) mutant show a drastic change in kinetics as the magnitude of depolarization is changed. Thus, at small depolarizations, the charge returns quickly as one exponential component while at larger depolarizations the charge returns slowly after a pronounced rising phase in the off gating current (see Fig. 4). The potential at which this change occurs is close to the voltage at which ionic conduction is first observed, indicating that the return of charge is slowed down when the channel reaches the open state. Chen et al. (25) carried out a systematic study of the off gating currents as a function of the permeant ions in Kv1.5 K channel. Their results show that the off gating current at potentials at which the channel opens is slowed down when there are no permeant ions present, but they are much faster when there is K or Cs inside the cell. In addition, they showed that the nonconducting mutant W472F also exhibits slow off gating after pulses that populate the open state. These results indicate that the anomalously slow kinetics of the off gating recorded in the nonconducting mutant are not the kinetics of off gating in the normal channel. Chen et al. (25) proposed that the empty open channel progresses faster to an inactivated state than the filled channel. This explanation would account for the slow down of the off gating currents in the absence of permeant ions because the channel would have to exit from this inactivated state before closing, and that step would be rate limiting. In the case of the nonconducting mutant, the channel would be devoid of permeant ions, and it would also show this slow recovery from this inactivated state. It is interesting to note that when temperature is lowered, the rising phase of the off gating current disappears (76), indicating that the closing rate becomes comparable to the exit rate from the hypothetical inactivated state.
The results of Chen et al. (25) imply that in attempting a fit to a global model that considers ionic and gating currents simultaneously in the K channel, corrections must be applied when using ionic current data from the conducting channel and gating current data from the nonconducting channel.
E. High Bandwidth Reveals New Features of Gating Currents
When gating currents of Shaker K channels are recorded with bandwidths reaching 200 kHz, Stefani and Bezanilla (
96, 97) found that the main gating current is preceded by a fast event that can be two to three times larger than the peak of the main gating current and decays with a time constant of ~10 µs. Extremely extended bandwidth is required to observe this fast transient, which means that the combination of the preparation and recording apparatus must have high-frequency responses. This can be achieved with large or giant patches where the access resistance times the membrane capacitance can charge the membrane patch with time constants shorter than 3 µs (53 kHz) provided the patch is homogeneous (98). This patch, when combined with an integrating headstage followed by a high-speed differentiator, can give the required frequency response to record the early gating event. The subtraction of the capacity transient must be done at positive potentials, which is a region with minimal nonlinear charge movement. The fast early event is observed in the on and off gating current preceding the rising phases of both currents as if it were a parallel movement of charge that only amounts to ~1% of the total gating charge. Forster and Greeff (35) recorded a similar event preceding the Na gating current in the squid axon where a very fast clamp can also be achieved with series resistance compensation that is not required in the giant patch.The early fast event is proportional to the main gating current and has not been observed in nonexpressing oocytes (96, 97). In addition, fluctuation analysis of the gating currents does not show noise associated with this fast event (98). These considerations indicate that the movement of charge that generates the early event current is not a separate peripheral charge, but it may be part of the main charge moving a very small elementary event that does not produce detectable shot noise. A simple interpretation of the early fast event may be found when the transfer of charge between conformations of the channel is modeled as a Brownian motion instead of a purely discrete process (see sect. IIIF and Sigg et al., Ref. 85).
F. Gating Currents as a Brownian Motion of Charge
Consider again that the independent variable is the charge displacement q (see Fig.
3A). The progress of the channel activation in the q axis occurs as a diffusion of a charged particle in a unidimensional landscape of energy. This energy landscape can be tilted up or down depending on the voltage applied to the membrane according to Equation 3. It is easy then to see that the kinetics of the outward charge movement will increase with depolarization and, correspondingly, the inward current will increase with hyperpolarization (see Fig. 6). If the landscape is flat and the friction coefficient is constant, then the predicted currents will differ significantly from the recorded gating currents because they will show a pronounced shoulder before the decaying phase (14, 51). In addition, there will be no large shots of charge as the gating charge progresses from one end to the other of the energy landscape.
|
A more realistic situation arises when the Brownian motion of the charge occurs in a rough energy landscape as discussed in detail by Sigg et al. (85). In this case, the energy landscape has valleys and peaks, i.e., it has energy barriers. Because the charge is subject to diffusion, it can be at any point of the landscape as opposed to the discrete case in which it only can dwell in the valleys or wells. The exact treatment of this problem using the Fokker-Planck equation and using a discretization technique allows the solution in terms of a large number of exponential components that can be traced to the drift process (fast) and the actual barrier crossing (slow). The fast process corresponds to the diffusion process and induces fluctuations of very high frequency that correspond to the thermal noise (Nyquist equivalent). The slow processes induce low-frequency fluctuations that correspond to the waiting times of the charge before they drift over the barriers. However, the actual transition times are extremely short because the drift of the charge is very fast, and they appear as shot events in the gating currents. In the limit when barrier heights are larger than 4-5 kT, the slow process is indistinguishable from the classical discrete treatment of the problem (85). In this view, an application of a depolarizing pulse will produce a sudden tilt of the energy landscape, and the equilibrium distribution of the diffusing particle in the wells will be changed according to the change in the well shape induced by the voltage change (see Fig. 6A). The redistribution of the charge in the new well shape will produce a current in the external circuit with a speed limited by the drift motion of the voltage sensor charge (see spike in Fig. 6B). This transient charge rearrangement corresponds to the early event in gating described in section IIIE. Only after a longer delay will the particle overcome the barrier in a fast event that originates the gating shot described above which will show as an exponential decay for the macroscopic gating current (see the decay phase of the gating current shown in Fig. 6B). The application of this theory to several examples with different number of energy wells and peaks is illustrated in Sigg et al. (85).
It is possible to qualitatively account for the results of macroscopic gating currents, the noise behavior, and the early event in gating by considering an energy landscape with small barriers, each spanning a small amount of charge favored at hyperpolarized potentials, followed by a few large barriers, each spanning a large amount of charge before leading into the open state of the channel (when q = Qmax). A sudden depolarization will first redistribute the charge within the first few wells creating the fast early event. Then the first few barriers will be traversed generating the Q1 portion of the gating current. As these barriers span a small charge, the evolution of Q1 will generate small fluctuations that may well be undetected. Only after the charge evolves across the large barriers, which span a large charge, will the bulk of the gating current be generated together with large fluctuations due to the shots produced by crossing those barriers.
G. Gating Currents and Channel Conduction
A detailed study of macroscopic currents and single-channel recordings of the Shaker B (IR) channel was done by Hoshi et al. (
43) and Zagotta et al. (118). The time course of activation could not be explained by a simple model with 4 independent subunits each with 2 states (39) but required more than 2 states per subunit, generating a multistate model that has a total of 15 distinct states in the case of a 3-state subunit. Their analysis of single-channel recordings indicated that after the channel is open it can evolve to a closed state that, as it is favored at positive potentials, does not belong to the activation pathway leading to the open state. In addition, because their results indicated that the opening step has a small voltage dependence, it constrained the large charge to a step preceding the opening step of the channel.Oxford (67) introduced a pulse procedure that allows the investigation of the kinetics of the last step in opening. It consists of giving a large depolarization that opens most of the channels, followed by a brief hyperpolarization that closes the channels but not long enough to allow them to return to the resting state. After this brief hyperpolarization, another large depolarization is given, and the current kinetics are analyzed. If the hyperpolarization is brief enough and the opening step is not extremely fast, most of the activation during the second depolarization will be a reflection of this opening step. If the last step is rate limiting, the current during the second depolarization will be close to a single exponential. When this pulse procedure was applied to Shaker B (IR) channel, it was found that there were three exponential components, but clearly, the fastest one was predominant (75). In this same study, the rate of this very fast (100 µs) predominating component was found to be voltage and temperature independent. On the other hand, the closing rate from the open state, estimated by the time constants of the ionic current tails, had a large temperature dependence (Q10 > 4) and had an estimated charge of 0.5 e0. These results allow estimating that the open state is favored with respect to the last closed state by a decrease in enthalpy and entropy, which indicates that the channel becomes more ordered in the open state. A similar result was found in batrachotoxin-modified squid Na channels by Correa et al. (29) using single-channel analysis. The open state is enthalpically favored but entropically hampered, giving a very small net free energy change. The decrease in entropy in the open state as compared with the last closed state implies a decrease in the degrees of freedom of the channel molecule. For a class of models that requires all subunits contributing symmetrically to channel opening, this finding is expected because to maintain the channel in the open conformation requires all the subunits to be in their optimal position; any deviation from this optimal conformation would render the channel nonconducting.
Chapman et al. (24) have described subconductance levels in the Drk1 K channel. The levels seem to be associated with the degree of activation of the channel, indicating that some of the closed states may actually not be completely closed or completely open. In the tetrameric channel there are conformations that will have one, two, or three subunits in the open conformation while progressing through the activation pathway. The authors indicate that some of these conformations may be stable enough to show up as intermediate levels of conductance in single-channel records, suggesting that the pore formation, although incomplete, allows conduction at a lower rate. Zheng and Sigworth (120) have also recorded subconductance levels in Shaker mutants and have been able to determine differential selectivity between the levels, indicating a different conformation of the selectivity filter in those subconductance states. Although these subconductance levels have not been observed in the wild-type Shaker (IR) channel, these results are in agreement with the notion that the formation of the open pore is the contribution of the four subunits and that it may be possible to observe an incomplete pore as the channel progresses to the fully open state. In the wild-type channel, the states that give origin to the subconductance levels may be populated too briefly to be detected reliably.
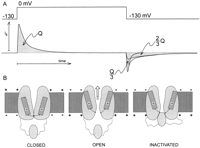
H. Inactivation of the Conductance
One of the salient features of Na conductance is that in response to a depolarizing pulse, the magnitude of the current first increases and later decreases during the pulse. The current decrease was called inactivation by Hodgkin and Huxley (
39), and it was characterized as another voltage-dependent process, albeit with slower kinetics than activation, which is the process that increases the current during a depolarization. As a voltage-dependent process, inactivation also had a voltage sensor in the Hodgkin and Huxley formulation and in fact was modeled as a completely independent process with intrinsic voltage dependence. Goldman and Schauff (36) proposed that inactivation might be a process coupled to activation, and they could account for the macroscopic current data. When gating currents of the Na channels were recorded, the component associated with inactivation was not found. Instead, it was found that the inactivation process modified the activation process, suggesting coupling.The return of the charge after a depolarizing pulse was greatly affected by
the duration of the pulse, such that for short depolarizations all
the on charge returned in the off charge, but for long
depolarizations, the off charge seemed to be only about one-third of
the on charge. The time course of this charge decrease (or charge
immobilization) corresponded to the time course of the ionic current
inactivation. This inequality of charge seems like a direct violation
of the basic conservation required in a displacement current. The
explanation is that in fact all the charge returns in the off but in
two separate components: a fast component that is easily detectable
and a slow component that at
![]() 70 mV
escapes detection. By making the voltage at the off more negative,
the slow component becomes visible, and the total off charge matches
the on charge. In addition, it was found that the slow component in
the off had the time course of recovery from inactivation (Ref.
7, Fig. 7A).
70 mV
escapes detection. By making the voltage at the off more negative,
the slow component becomes visible, and the total off charge matches
the on charge. In addition, it was found that the slow component in
the off had the time course of recovery from inactivation (Ref.
7, Fig. 7A).
|
From these experiments a clear picture emerges. During a depolarization, first the voltage sensor repositions the activation charge to open the channel. Then a separate conformational change in the channel prevents conduction and at the same time freezes up to two-thirds of the activation charge that moved to open the channel. Upon repolarization, the third of the charge that was not immobilized returns quickly, and the other two-thirds of the charge returns as the inactivation is recovered.
To explain these results, Armstrong and Bezanilla (7) proposed that inactivation of the ionic current is the result of an inactivating particle (ball and chain, see Fig. 7B) that blocks the channel from the inside and at the same time hampers the movement of the activation charge. The affinity of this particle for its site is increased as the channel progresses toward the open state. This inactivation particle could be cleaved off by internal perfusion of the axon with the protease pronase (8). As expected from this hypothesis, when the particle is cleaved off, the charge immobilization was no longer observed. This hypothesis could be cast in a kinetic model that explained most of the observations of ionic and gating currents, and this model did not require a voltage-dependent step for the inactivation itself. In this view, the voltage dependence of the inactivation process is borrowed from the steep voltage dependence of the activation process. It was later found that to account for the experimental data of single channels, macroscopic ionic currents, and gating currents, a small voltage dependence in the inactivation step is required. The voltage dependence is small and amounts to the equivalent of less than one charge (3, 4, 107, 108).
I. Kinetic Models of Channel Operation
A first step in understanding the operation of the voltage sensor and its coupling to the conducting pore is to propose a kinetic model that is able to reproduce the experimental data. The first successful model of channel activation and inactivation was proposed by Hodgkin and Huxley (
39). For the K channel, their model is based on the independent operation of four gating particles each undergoing a single transition from a resting state to an active state; the channel only conducts when all four are in the active state. Although this model has served as a basis of much of our understanding of voltage-dependent channels, it does not account for the details of activation when data of macroscopic ionic currents are complemented with single-channel and gating current recordings. It is clear that to account for the delay in activation and the Cole-Moore shift, a minimum of six sequential steps is required and the Hodgkin-Huxley model only has five. To account for the details of gating currents, about eight states are required, and the progression of the rate constants from the most closed states to the open state does not follow the predicted 4,3,2,1 ratios calculated from the progress of four identical independent subunits.We can classify kinetic models in two general types: tetrameric (scheme I)
and strictly sequential (scheme II)
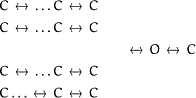
|
(Scheme I) |
|
|
(Scheme II) |
The tetrameric structure of the Shaker K channel gives a solid basis to build a model around four subunits as Hodgkin and Huxley originally proposed. Because the original Hodgkin-Huxley model is not adequate, it was modified by adding one more state in each subunit, a model we may call three state, four subunit (119). The physical interpretation of the three-state four-subunit model is very simple because it assumes that each subunit acts independently of each other while it evolves toward the open state. This model generates a total of 15 states (after reducing the degenerate states) with an added blocked state after the open state. All the rates between states are predicted from the individual rates and the stoichiometry except for the return path from the open state where the first transition was made much slower than predicted to account for the details of the currents. The other approach was to add more states (to a total of 8) to the sequential equivalent of the Hodgkin-Huxley (8-state) model (13). The physical interpretation of the 8-state model is not as straightforward, but it could be thought of as a modified Hodgkin-Huxley model where there are interactions between subunits and extra concerted steps before channel opening. The three-state four-subunit model does a fair job in reproducing the major features of the ionic currents, but it does not do as well as the eight-state model in reproducing the features of gating currents.
The substitution of hydrophobic residues in S4 segment of Smith-Maxwell et al. (90) and Ledwell and Aldrich (48) indicates a high degree of cooperativity in the last step of channel opening, which was incorporated as one more concerted step in the three-state four-subunit model and built in for the eight-state model. In their study of the multiple mutant V369I, I372L, and S376T (called ILT mutant), they found that the last step becomes rate limiting and allows the measurement of as much as 1.8 e0 during that transition. In contrast, Rodriguez and Bezanilla (75) measured 0.5 e0 in the last step of wild-type Shaker(IR). In their modeling (48), the Shaker concerted transition has 0.4 e0 and the ILT mutant 1.8 e0. Their explanation of this difference is either a difficulty in determining the last step in the wild type or that there is a change induced by the mutation. In any case, the ILT results could be considered a way to make the interaction between subunits more apparent in the last transition to channel opening. The model proposed by Schoppa and Sigworth (81) includes two cooperative steps after each of the four subunits has made three transitions. The total charge in those two steps is 1.8 e0, and it was constrained by the results of the V2 mutant (79, 80). The last step of those two cooperative steps carries a charge of 0.7 e0, not far from 0.5 e0. By separating the concerted charge in two steps, this model seems to reconcile the differences in the apparent charge measured in the last step by the three groups.
The study of the detailed kinetics of gating currents as a function of voltage and temperature by Rodriguez et al. (76) was another opportunity to test models with more constraints because the individual charges should be conserved across temperatures. The authors compared the three-state four-subunit model with a variant that adds one more concerted step before opening and a variant of the eight-state model that makes several of the intermediate steps identical and a blocked state at the end (11-state model). The features of gating currents could be reproduced well by the 11-state model at 11 and 21°C, but it was not possible to reproduce the kinetic features for both temperatures with the three-state four-subunit model.
Models that explicitly take into account the tetrameric structure of the channel are preferred because they can be correlated with the structure and, eventually, converted into more physical models of activation. In addition, the number of free parameters required are less for the tetrameric models as compared with sequential models, unless in the latter ones many of the steps are made kinetically identical to each other. The failure of the three-state four-subunit model to account for the details of gating currents seems to be related to the early part of gating. As much as one-third of the charge (Q1) moves in the very negative region of the Q-V curve, with fast kinetics and low temperature dependence (76) as if it were the result of diffusion of the gating particle along a landscape of energy with many barriers, each of low amplitude. This can easily be generated by the 11-state model, but the 3-state 4-subunit model does not quite reproduce the features of Q1. One possible way to overcome this problem might be to relax the independence in the early steps at the expense of increasing the number of parameters. Another approach to improve on the early steps for the tetrameric models has been followed by Schoppa and Sigworth (81), who added one more state to each subunit, generating a four-state four-subunit model. In this four-state four-subunit model, the charges in each step are now smaller to account for the maximum total charge of ~13 e0, making it less likely to reproduce the 2.4 e0 shot recorded in Shaker (see sect. IIIC; Refs. 86, 98), although this prediction has not been verified.
In summary, none of the kinetic models of activation has been able to reproduce all the features of ionic, gating, single-channel, and gating noise data, including temperature dependence. The difficulty may reside in that more steps are needed to fully account for the experimental data. The problem is that more steps add more parameters, making it very difficult to find a global minimum during minimization. The future approach may be the development of kinetic modeling constrained by the emerging structural features aiming at physical modeling of activation.
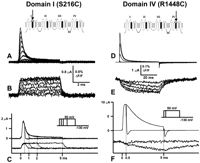
Fast inactivation adds more states to the activation models. In a fully uncoupled model, as is the case of the Hodgkin-Huxley model, the transitions from noninactivated states to the inactivated states are all the same but voltage dependent. The experimental evidence indicates that inactivation is coupled to activation, but the degree of coupling is not yet fully determined. In the case of the Na channel and the ShakerB channel, inactivation couples to activation, and the result is charge immobilization. We will see in section IVD5 that site-directed fluorescence labeling has made it possible to assign some of the inactivated states to specific sensors in the Na channel structure.
| |
IV. MOLECULAR BASIS OF THE VOLTAGE SENSOR |
|---|
|
|
|---|
The two most important voltage-dependent processes, activation and inactivation, are intrinsic properties of the channel molecule. The description of the operation of both processes at the electrical level (single channel, macroscopic ionic and gating currents) results in kinetic models that are useful to give a general idea of the possible states of the channel but cannot pinpoint the actual physical structures that give origin to the electrical events. It is then necessary to use other techniques such as site-directed mutagenesis, chemical modification, or optical techniques in combination with the electrical measurements to determine the structural elements that give origin to the voltage dependence. The simpler nature of the inactivation process made possible the identification of its structural basis before activation. Therefore, we start with the physical basis of inactivation before proceeding to the location of the structures responsible for activation.
A. Locating the Structures Responsible for Fast Inactivation
When the ball and chain hypothesis was proposed, it was clearly more precise than anything that could be advanced for the activation process at that time, which was still considered as a black box (
7). The experimental verification of the hypothesis took longer than expected for the Na channel, and there are still many unexplained features. However, for the case of the inactivating K channel (ShakerB), the hypothesis turned out to be quite appropriate.1. Shaker K channel
The ShakerB channel is a delayed rectifier K channel that inactivates similarly to the Na channel. Soon after this channel was cloned and expressed in Xenopus oocytes, Hoshi et al. (
41) identified the ball and chain in the structure guided by comparisons with other Shaker channels. Removal of amino acids 6-46 of ShakerB completely abolished fast inactivation in the new channel (ShakerB-IR). In addition, Zagotta et al. (117) could restore fast inactivation by adding the peptide made from amino acids 1-20 to the inside face of the ShakerB-IR channel. The next step was to record the gating currents of ShakerB and compare them with the ShakerB-IR. The results were exactly as expected: ShakerB shows gating current tails with a fast component and a very slow component. The fast component of the repolarization tail recovers all the on charge for short depolarizations, but only about one-third of the on charge for long depolarizations. In contrast, ShakerB-IR did not exhibit the very slow component in the tail, and all the on charge was recovered in one component regardless of the pulse duration (12). To be able to record the gating currents, these experiments were done in the absence of K, which added a complication. Using single-channel analysis, Demo and Yellen (31) showed that at the end of a long depolarization, ShakerB could recover from inactivation through the open state because there were clear single-channel events during the repolarization phase. These experiments were done with K outside and indicated that the ball could be cleared from its blocking position by incoming K through the pore. This is in clear contrast to the recovery from inactivation in Na channels where the external Na does not influence recovery from inactivation and no recovery from inactivation is observed through the open state (11). This, of course, is expected in the Na channel because normally the Na concentration is high outside, and the channel must inactivate efficiently with this high Na outside. A more detailed study of charge immobilization in ShakerB was done by Roux et al. (77), who concluded that in the presence of external K, some of the recovery from inactivation occurs through the open state, whereas in the absence of external K the recovery proceeds through closed states after populating a series of inactivated states. The charge movement through these inactivated states corresponds to the movement of the nonimmobilized gating charge that originates the fast component of the gating current tail. The charge returns to its normal resting position only after the ball and chain undocks from the channel mouth, allowing the reimmobilization of the immobilized gating charge, giving origin to the very slow component of the gating current repolarization tail.Once the inactivation particle was found, a number of studies addressed the question of which residues are critical for function of the ball and chain (62, 105, 106). The structure of the ball and chain consists of 11 hydrophobic or uncharged residues and a stretch of 8 hydrophilic residues, 4 of them basic. When leucine-7 is changed to a polar or charged residue, inactivation is largely removed (41), indicating that the binding of the ball peptide is disrupted and that the interaction in the site is hydrophobic. Using a synthetic ball peptide in the ShakerB-IR, Murrell-Lagnado and Aldrich (62) confirmed that an hydrophilic substitution in L-7 increased the off rate of the peptide. In addition, they found that a charged residue in Y-8 also increased the off rate significantly. This could be interpreted as the hydrophobic surface of the ball that contacts the hypothetical hydrophobic region in the channel that constitutes the binding site. The hypothetical site could be the carboxy-end of the S6 segment that makes up the intracellular mouth of the pore, by analogy with the KcSa channel (32). Perozo et al. (71, 72) have used electron paramagnetic resonance to study the accessibility of the inner helix of KcSa channel as function of pH, which gates the channel open and closed. They found that the opening of the channel is concomitant with a rotation and spreading apart of the intracellular portion of the inner helices. This suggests a possible mechanism for the docking of the ball into the mouth of the channel. In this view, the hydrophobic site where the hydrophobic surface of the ball should contact would be normally inaccessible in the closed conformation and would become exposed upon gating the pore open. Because the electrophysiological data indicate that charge immobilization occurs even at potentials where the Po is very low (14), the binding of the ball may be possible when only one or two of the S6 segments move into the open position. The net positive charge of the ball and chain seems to play a role in the on kinetics. Neutralization or charge reversal of E-12 or D-13 speeds up the on rate significantly. On the other hand, neutralization of R-17, K-18, and K-19 drastically decreases the on rate (62, 105). A simple interpretation is that the positive charge in the chain will orient the ball into its docking site, increasing the frequency of encounters between the positively charged inactivating particle and a putative negative charge near the docking site in the channel, facilitating the establishment of inactivation.
The search for the docking site of the inactivation ball has concentrated in the linker between S4 and S5 segments. Isacoff et al. (44) found that a series of mutations in this linker affect inactivation and proposed that this region forms part of the inactivation receptor. Holmgren et al. (40) did a systematic study of the S4-S5 linker using cysteine substitution mutagenesis and chemical modification. They found that chemical modification of position A391C modified the kinetics of the ball peptide without changing other properties of the channel. By changing the reactant group to attach different charges, they concluded that there are both steric and electrostatic interactions between this site and the ball peptide. The results are consistent with the idea that the ball peptide behaves as point charge and that there are no specific charge-charge interactions between the peptide and the docking site. This conclusion is consistent with the proposal of Murrell-Lagnado and Aldrich (62) that the long-range electrostatic interactions increase the diffusion rate of the ball peptide toward its binding site, thus increasing the on rate of inactivation.
2. Na channel
It took longer to find the inactivating particle in the Na channel structure. Stuhmer et al. (
100) had found that by cutting between domains III and IV of the brain Na channel, fast inactivation was largely abolished. Many mutagenesis trials finally showed that if the IFM motif in the cytoplasmic linker between domains III and IV was changed to QQQ, fast inactivation was abolished (109). These experiments identified a critical region of the protein that could be something like the ball, but because it has two chains, it was called a hinged lid. Attempts at using the IFM motif to mimic inactivation on a noninactivating Na channel were unsuccessful unless the motif was flanked by positive charges (34), and even this modified motif did not reproduce fast inactivation but behaved more like a local anesthetic (101). Part of the putative receptor for the inactivation particle has been identified in the intracellular portion of of the S6 segment of the fourth domain (59). It is interesting to note that the simple hypothesis of the ball and chain mechanism, originally proposed for the Na channel, applies better to the inactivating ShakerB K channel than to the Na channel itself.B. Locating the Structures Responsible for Voltage Sensing
There are multiple ways one can envision voltage sensing. Figure
8 shows a few examples that are not mutually exclusive. Charge movement may be the consequence of changes in polarization in the protein, such as the reorientation of an internal dipole (Fig. 8A) or movement of a charged basic or acidic group (Fig. 8, B and C). An
|
Two basic approaches have been taken to elucidate the contribution of the charges in the S4 segment to the voltage sensor. In both approaches it is assumed that the mutation introduced does not change drastically the structure of the molecule. The first is to count the charges per channel (see sect. IIC) in channels where a particular charged residue has been neutralized, and the second is to study the accessibility and environment of a charged residue after it has been replaced by cysteine, or histidine. It must be noted that a change in accessibility does not necessarily demonstrate the involvement of that residue in gating currents. This is because the residue in question may become buried in another region of the protein and consequently may not be moving or changing the field, which means it is not part of the voltage sensor. On the other hand, counting charges per channel after neutralization does imply directly the involvement of that charge in the total gating current (see sect. II, B and C). Because the electrical measurement determines the product of the charge times the fraction of the field moving (see Eq. 2), a charge decrease after neutralization may imply a change in the field sensed by the other charges, even though that particular charge does not move at all in the field. Considering that the charge movement is the contribution of the charges and the field, a change in either one or both after neutralization is a direct indication that such charge is part of the voltage sensor.
1. Charge neutralization identifies residues contributing to the gating charge
In two published studies of the assessment of the gating charge per channel after charge neutralization, it has been shown that several of the basic residues in the S4 and one acidic residue in the S2 segment are involved in generating the gating current (
1, 83). In the study of Aggarwal and MacKinnon (1), the total charge was obtained as the nonlinear part of the total capacitative current of oocytes expressing the neutralized construct under two-electrode voltage clamp. The number of channels was estimated by measuring the number of radioactive bound molecules of the specific pore blocker agitoxin to the channel. In the study of Seoh et al. (83), the total charge was estimated from gating current determinations in patches and the number of channels by noise analysis in the same patch. In addition, the total charge per channel was estimated by the limiting slope method corrected with the use of the Q-V relationship measured in the same mutant (see sect. IIC). The two studies are summarized in Table 1, and they both show that several of the basic residues in the S4 segments are involved in gating, although they do not estimate the same exact contribution of each residue to the total charge. As a reference of the amino acid sequence of the S4 segment in Shaker, refer to Figure 2.
|
The total charge per channel of the wild-type ShakerB (IR) estimated with the toxin method is 13.6 e0 (zQ/N, Ref. 1), almost one charge larger than the charge estimated by the noise method (ZQ/N, Ref. 83) or the modified limiting slope method (z, Ref. 83). The difference is small and might not be significant, although a previous estimate by the noise method (79) also gave a value less than the toxin method. Table 1 shows that the noise method and the modified limiting slope method show good agreement except for mutation E283Q. This agreement reinforces the idea that all the nonlinear charge of the Shaker K channel is directly connected to the opening of the channel and that there is no peripheral charge involved (see sect. IIB). It has not been possible to neutralize residue R377 without loss of function (69), so the participation of that residue in the gating charge could not be determined with either method. However, recent results with histidine scanning mutagenesis (see sect. IVC2) suggest that R377 does not participate in gating.
Seoh et al. (83) could not determine the charge per channel when residue R362 (1st charge) was neutralized because the channel seemed to acquire a second open state for which neither the method of Q/N nor modified limiting slope could be applied. However, Aggarwal and MacKinnon (1) were able to determine a reduction of four charges upon neutralization with methionine.
The second, third, and fourth charges were all found to contribute to the total gating charge. The second charge (R365) was found to be similar by both studies, but a larger contribution was found by Seoh et al. (83) than Aggarwal and MacKinnon (1) for the third and fourth charge. The differences are unexplained, but both methods used by Seoh et al. (83) gave about the same charge reduction upon neutralization. The fifth charge (K374) cannot be neutralized without the loss of function unless it is replaced by serine, and it was found to contribute with only two charges when tested with K374S. Seoh et al. (83) used a simultaneous neutralization of K374 with either E293Q or D316N to maintain function (69, 104) and found the effect was equivalent to neutralizing just the negative charge, indicating no participation of this residue in gating.
From these studies, we may conclude that the first four charges in the S4 segment all contribute about 1 e0 per subunit to the gating current, whereas the fifth charge may have a smaller contribution, and the last charge does not participate at all in voltage sensing. A picture emerges from these results that charged residues closer to the extracellular side seem to be the most important for gating, whereas the intracellular residues may not contribute significantly. Instead, these residues may be involved in stabilizing the folding of the protein into its final configuration (104). If we assume that there are no drastic conformational changes as a consequence of residue neutralization, then the effects of neutralization may be explained by at least two different reasons. Either neutralization removes the charge that participates in the movement of the total gating charge, or neutralization modifies the electric profile seen by the remaining charges. It is tempting to assume that a decrease of four charges means each subunit is moving the charge across the entire electric field, but this assumption would ignore the fact that the removal of that charge may change the electric field seen by the other charges. We can conclude that at least the first four most extracellular charged residues in the S4 segment of Shaker are responsible for a large fraction of the gating current, but we cannot define precisely how much each residue contributes to the total gating charge.
The negative charges in S2 and S3 are conserved among most voltage-dependent ion channels and have been implicated in voltage sensing (74, 83) but, as discussed in section IA, their involvement can only be substantiated by measuring charge per channel in neutralization mutants. Seoh et al. (83) measured the effect of neutralization of the acidic residues in S2 and S3 segments (see Table 1). The conclusion is that the outermost negative residue in S2 (E283) does not directly participate in gating, whereas neutralization of the innermost glutamate in S2 (E293) appears to affect gating charge drastically. The neutralization of the negative residue in S3 (D316) produces a small decrease (~2 e0) in the total charge per channel, which was not found to be statistically significant, but was consistently found with both methods of charge estimation. The neutralization experiments suggest that the voltage sensor may be an assembly that includes S2, S3, and S4 with most of the charge contribution given by S4.
It is important to note that in all the neutralization mutants studied by Seoh et al. (83), the maximum Po did not change even when there were drastic reductions in the total charge movement. This implies that none of the tested neutralizations affected the open position in the movement of the voltage sensor. Because the turn-on lag of the neutralization mutants was not drastically affected, it appears that the initial position of the sensor was also unchanged. This contradicts the suggestion that neutralization mutants have an abridged S4 motion (9).
A model of operation of the sensor that includes the three transmembrane segments has been proposed by Papazian and Bezanilla (68), which accounts for the results of neutralization and the charged network results of Papazian et al. (69) and Tiwari-Woodruff et al. (103). In the revised version of this model (Fig. 9), the first four charges in the S4 segment are lying in a narrow aqueous crevice connected to the intracellular medium in the closed state and an aqueous crevice connected to the extracellular space in the open conformation. A depolarization would translocate all these charges from one aqueous crevice to the other without a large movement of the S4 segment, but this requires a very focused electric field, especially in the closed conformation. This is described below in the histidine-scanning mutagenesis (see sect. IVC2), site-directed fluorescence labeling (see sect. IVD), and lanthanide-based resonance energy transfer results (see sect. IVE). These experiments confirm the existence of these aqueous crevices and support a general gating mechanism that translocates a large amount of charge with a relatively minor movement of the S4 segment. Notice that in this type of model (Fig. 9) a neutralization of one of the charges may obliterate the aqueous crevice, producing a drastic change in the electric field pattern seen by the other charges. For example, by neutralizing R368, the aqueous crevice would stop at that point, and the field that was originally concentrated around R362 it would now span the region of R362 and R365 (68). Under those conditions, if the sensor moves the same distance as expected from the invariant Po, the product of the charge times the fraction of the field by these two residues would be less than in the normal case and give a decrease larger than the expected 4 e0 upon R368 neutralization (see Table 1).
|
C. State-Dependent Exposure of Sensor Residues
1. Cysteine-scanning mutagenesis reveals translocation of charges across the membrane
In this method, a particular residue is mutated to a cysteine, and the reaction rate of the cysteine to a cysteine reactive species such as a methanethiosulfonate (MTS) derivatives (
2) or mercurials is measured. If the reaction has an effect on the ionic currents, then one can assess the availability of the cysteine group by measuring the reaction rate at different membrane potentials and pulse protocols. In the ideal case, if the reaction has a measurable effect on the ionic currents of the channel and the Cys group is exposed to the bulk solution at one voltage (V1) and not at another voltage (V2), then one would see a fast reaction rate of the current modification at V1 and no appreciable reaction at V2. An important caveat is the reactivity of the cysteine sufhydryl that depends on the local pH, which in turn may be affected by the voltage itself or the voltage-induced conformational change.A) SODIUM CHANNEL. The work of Yang and Horn (112) was the first to establish that a cysteine-mutated charged residue of the S4 segment changes its exposure with the membrane potential. In the skeletal muscle Na channel, the mutant R1448C (see Fig. 2) has a slowed rate of inactivation. When the cysteine group is reacted with MTS-ethyltrimethylammonio (MTSET), the inactivation rate speeds up again. These authors found that the rate of modification was dependent on the voltage applied while MTSET was present. The voltage dependence of the rates was similar to the expected Q-V curve of the channel, as inferred from the fourth root of the conductance. This remarkable result indicates that the exposure of position 1448 follows the activation of the voltage sensor and showed for the first time that part of the S4 segment or some other region of the protein nearby is moving, or that the ionization of the sulfhydryl is changing as a result of changing the membrane potential. This work was followed with a more detailed study of the other charged residues in the S4 segment of domain IV (110). The accessibilities of the cysteine-substituted charged residues were tested from the inside and outside, and a clear pattern emerged. The second and third charges (see Fig. 2) can be accessed from the inside at hyperpolarized potentials and from the outside at depolarized potentials. On the other hand, the first charge was accessible from the outside at depolarized potentials, but hyperpolarization did not expose it to the inside. The next two deeper charges were exposed to the inside regardless of the membrane potential. These results suggest that the hydrophobic region the first three charges traverse is quite short. In addition, they show that the charges are for the most part exposed to the bulk solution, except during the transition of the S4 segment from the resting to the active position. Yang et al. (110) proposed a model whereby the S4 segment lay within a water-filled vestibule with all except the first charge exposed to the intracellular solution at hyperpolarized potentials. Upon a depolarization, the segment moves toward the outside, exposing the three outermost charges to the outside and thereby transferring the gating charge that generates the gating current.
B) SHAKER POTASSIUM CHANNEL. The equivalent exposure studies were done soon after in the S4 segment of the Shaker K channel (see Fig. 2) by Larsson et al. (47) and Yusaf et al. (115). Larsson et al. (47) used MTSET as a cysteine reagent, whereas Yusaf et al. (115) used p-chloromercuribenzenesulfonate (PCMBS). The strategy was also different because Larsson et al. (47) mutated charged residues to cysteine, whereas Yusaf et al. (115) mutated uncharged residues in an attempt to preserve the charge of the S4 segment. More recently, Baker et al. (9) extended the study of Larsson et al. (47) by combining a fluorescent reporter (see sect. IVC1) with the exposure changes of cysteine.
Table 2 summarizes the results of the three groups that utilized cysteine-scanning mutagenesis on the Shaker K channel in addition to the results of histidine-scanning mutagenesis by Starace et al. (95) and Starace and Bezanilla (93, 94) (see sect. IVC2). The experiments of Larsson et al. (47) indicate that the two most extracellular basic residues (R362, R365) become accessible to the outside upon depolarization, agreeing with the results of Yusaf et al. (115) who used PCMBS instead of MTSET. Larsson et al. (47) found that the third basic residue (R368) was inaccessible in the depolarized state, but Baker et al. (9) revised their conclusions and found R368 accessible upon depolarization with the same cysteine reagent, MTSET. In the resting hyperpolarized state, the second and third basic residues (R365 and R368) were found to be accessible from the inside. The results for the first basic residue (R362) were also changed between Larsson et al. (47) and Baker et al. (9) in that the first study determined it to be exposed, whereas the second professed a buried position.
|
The only consensus conclusion from the cysteine scanning results is that depending on the voltage, only the second charged residue (R365) changes its exposure from the inside to the outside. However, according to one study, it seems that the third charge (R368) also changes its exposure from inside to the outside depending on voltage (9). The results from the Shaker K channel are in general agreement with those of Yang et al. (110) from the S4 of domain IV of the skeletal Na channel (see above) and indicate that some conformational change occurs during depolarization which results in a large change in the exposure of charged residues, giving a qualitative molecular basis of the charge movement of the voltage sensor.
2. Histidine-scanning mutagenesis reveals the translocation of four charges
The results of charge neutralization and cysteine-scanning mutagenesis suggested that the charged residues may be partially buried in water-filled crevices (see Fig.
9). This is supported by preliminary experiments with D2O as the bulk solvent which indicated that gating currents were drastically affected (92), but as a probe D2O is not specific and, with time D may slowly replace most of the H in the molecule. This prompted us to develop a different way to test accessibility with higher resolution and with minimal perturbation of the charged nature of the basic residues of the S4 segment. We turned to the use of protons as a probe that required a titrable group that can be manipulated in a range of pH compatible with the survival of a biological preparation, such as Xenopus oocytes. The ideal group is the imidazole ring of histidine which has a pKa near 6.5 and should be almost fully protonated at pH 5 or deprotonated at pH 9.The histidine accessibility experiments are based on the detection of the charge of a histidine group that replaces one of the intrinsic basic residues. Thus, if histidine replaces one of the charged residues that contributes to the gating current, then the charge transported in the gating current will be affected depending whether the histidine is charged or not. Therefore, the histidine-scanning experiments must be done by measuring gating currents, in the absence of overwhelming ionic currents that can be 200 times larger than the gating currents. Most of the experiments were done with the nonconducting version (W434F) mutant of the Shaker (IR).
Figure 10 shows schematically several possible outcomes of histidine-scanning mutagenesis depending on whether or not the histidine group becomes exposed to the bulk solvent. Notice that in all cases to detect an effect of solution pH on the gating current requires that the histidine group moves within the electric field and that the histidine is exposed to at least one of the two solvents. The first case (Fig. 10A) shows a situation in which the histidine is always buried and inaccessible regardless of the membrane potential; changes in pH either outside or inside the membrane will have no effect on the gating currents in this case. Of course, there will also be no effect of pH if the replaced histidine does not move in the field. The second case (Fig. 10B) represents a situation in which the histidine becomes exposed to only one side of the membrane when the S4 segment makes an excursion between the closed and open position, whereas it becomes buried in the other position. In this case, the gating charge transported will depend on the pH of the solution on the side where the histidine gets exposed; at low pH, the gating current will carry more charge than at high pH. In each pH, there will be equality of the charge during the on and off gating currents. Figure 10C represents a situation in which the histidine group can be exposed to either side of the membrane, depending on the membrane potential. If there is a pH gradient across the membrane, the histidine will pick up a proton when exposed to the low-pH side and release it when exposed to the high-pH side, producing a net proton current in the direction of the pH gradient. This net transport will be maximum at potentials where the voltage sensor has an equal probability of being in the resting or the active positions, the midpoint of the Q-V curve. This is because, as the voltage sensor makes frequent excursions to both positions, the histidine group will sample both sides of the membrane and carry protons from the most concentrated to the most dilute side. At potentials where the Q-V curve is saturated, there will be no net transport because the histidine will spend most of its time on one side of the membrane. In this case, the charge carried by of the on gating current will be different from that of the off current. The larger charge will move with the transition from the low-pH side to the high-pH side. The last case shown in Figure 10D represents a case in which at one of the positions of the sensor the histidine spans the gap between the inside and outside, creating a bridge or channel that conducts protons in the presence of a proton gradient. In this case, the proton current is not expected to be bell-shaped with voltage as in the case shown in Figure 10C. Instead, it will increase when it reaches the maximum probability of being in the bridge position and may keep increasing with increasing voltage or pH driving force.
|
Starace et al. (95) implemented the histidine-scanning technique to study the Shaker K channel and found that when the second or third charges of S4 (R365 and R368, see Fig. 2) are mutated to a histidine, a clear proton transport current was measured. Transport was maximum in the center of the Q-V curve and followed the pH gradient. This established that a histidine in either of these positions is exposed to the inside at hyperpolarized potentials and to the outside at depolarized potentials (see Table 2). Later studies by Starace and Bezanilla (93) showed that replacement of the next charge (R371H) with histidine also produces proton transport with similar characteristics to the previous two charges (see Table 2). A histidine in position R362 (the first charge) creates an inward proton rectifier with the characteristics of channel conduction, as pictured in Figure 10D (Starace and Bezanilla, Ref. 94). This result shows that a histidine in position 362 bridges the gap between the outside and the inside solutions when the membrane potential is hyperpolarized and indicates that at these potentials the hydrophobic region of the channel is extremely narrow. We do not know how the arginine, which is normally in this position, behaves with the membrane potential. However, because the arginine has a long hydrophobic chain separating the charged guanidinium group, it is possible that the charged group crosses the hydrophobic region under the influence of the electric field after some bending of the acyl chain.
The next two charges of the S4 segment in Shaker have also been explored with histidine scanning by Starace and Bezanilla (93; unpublished results). It is important to note that position K374 is in a charge network with D316 and E293 (103), and the protein does not mature after neutralization unless serine (1) or histidine (93) is used. Position R377 cannot be neutralized without the loss of function of the protein (69); however, a histidine replacement is tolerated and the protein expresses normally. When K374 or R377 was replaced by histidine (Starace and Bezanilla, unpublished results), the gating currents did not affect change in pH on either side, indicating that these two residues are either not accessible from the bulk, as pictured in Figure 10A, or do not move in the field (see Table 2).
The results of histidine scanning combined with cysteine scanning begin to delineate a rough picture of how the charged residues of the S4 segment of the Shaker K channel may change positions during voltage gating. First, at hyperpolarized potentials, residue R362 dwells in the narrowest part of a water-filled crevice connected to the interior solution, since a histidine at this position is accessible to protons, whereas a cysteine is inaccessible to cysteine reagent probes. Second, because cysteine reagents do not react with cysteine in position 370 in the depolarized state (Baker et al., Ref. 9; see Table 2), and protons do titrate a histidine at 371 (see Table 2), R371 dwells at the bottom of a water-filled crevice connected to the exterior at depolarized potentials. These results suggest that the four outermost S4 charges are all in water-filled crevices in contact with the internal medium at hyperpolarized potentials, and all four translocate to another water-filled crevice connected to the external medium at depolarized potentials. This view solves the problem of having to neutralize the basic residues of the S4 segment with negatively charged amino acids because these basic residues, in their stable positions, are in contact with an ionic solution that has counter ions. To cross from one side to the other, the charged residues will dwell transiently in the hydrophobic part of the protein, which constitutes the large energy barrier that the imposed voltage helps to overcome.
Any model of the translocation of the charged residues of the S4 segment must predict that the total charge transfer is ~13 e0. If we assume that the water-filled crevices are isopotential with the bulk solvent, the histidine-scanning results indicate that the total charge transfer is the sum of at least the first four charges (R362, R365, R368, and R371, see Table 2) across the entire field per subunit, giving a total of 16 e0. It is quite unlikely that the crevices are isopotential with the bulk solution because they are narrow and contain polarizable groups. Then at the very end of each of the crevices, the potential may not be the same as it is in the bulk, which means that the field would extend a bit into the crevices rather than be concentrated across the narrow gap formed between the two crevices at hyperpolarized potentials. In this case, the charge at the narrowest part of the crevice would not travel the whole extent of the field and would contribute <1 e0. For example, if we assume that the charge at the deepest end of the internal crevice contributes only 0.5 e0 and that something similar occurs at the deepest end of the external crevice, then each subunit would only contribute with 3 e0, making the total transfer of charge 12 e0. The model proposed in Figure 9 illustrates the internal and external crevices and the translocation of the residues from the resting to the active state for one subunit. We will see in section V that a similar model that also contains crevices but is based on a rotation of the S4 segment, as opposed to a simple tilt, will have the same basic properties and also accounts for the results of fluorescence resonance energy transfer (see sect. IVE).
D. Conformational Changes Detected by Site-Directed Fluorescence Labeling
Another method to test conformational changes during voltage activation is the use of fluorescent probes attached to specific sites of the molecule. This method detects changes in fluorescence emission caused by environmental changes that occur at or near the attachment site.
Some fluorescent probes change their emission spectrum, quantum yield, or absorption spectrum depending on the environment. This sensitivity opens the possibility of examining local changes seen by the probe produced by nearby conformational changes. Changes in the emitted fluorescence should follow the time course of the environmental changes with high time resolution because most probes have nanosecond lifetimes. The first measurements of site-directed fluorescence were done by Mannuzzu et al. (
58) in the Shaker (IR) K channel. These authors used tetramethylrhodamine maleimide (TMRM) that reacts with cysteine, and they tested two positions in the S3-S4 linker and three positions in the the S4 segment. The results show that the labeling depends on the position and the membrane potential at which the reaction takes place. Thus position 346 (in the S3-S4 linker) is equally labeled in hyperpolarizing or depolarizing solutions, whereas position 359 was preferentially labeled at depolarizing solution and position 365 was only labeled in depolarizing solutions. These results agree with the expectation that residues deeper into the S4 (toward the carboxy terminus, see Fig. 2) become exposed as the membrane potential is depolarized. These authors also measured the time course of the fluorescence at these sites as a function of membrane potential concomitant with the recording of gating currents and found that the normalized fluorescence versus voltage (F-V curve) measured at the end of 100-ms pulse agreed with the normalized Q-V curve for all the sites tested. They did not attempt a detailed comparison of the time course of the gating charge with the time course of fluorescence.The most appropriate comparison of fluorescence and gating is to consider the
charge position (see Fig. 11) that corresponds to
the time integral of the total gating current. This is also true if
the time course of the two signals are to be compared; that is, the
comparison should be done between the time course of the fluorescence
and the time course of the time integral of the gating current. It
should be pointed out that the fluorescence and the gating charge
position measure the same conformational change in very different
ways. As we reviewed in section IIIB,
the gating current is the sum of the contributions of all the
individual charge movements (see Eq. 8), whereas the
fluorescence change is showing the changes in the local environment
where the probe is located, which may emphasize only one of the
multiple components that make the total gating current. It is then
easy to see that the fluorescence will be equal to the charge
position in the simple case of a two-state model, but they may be
very different in the general case. For example, one can envision a
situation in which most of the charge moves very quickly and is
followed by a very slow conformational change. A fluorescent probe
located in the region of the slow conformational change will show
slow kinetics, but the gating current associated with that conformational
change may be too slow to be detected. In this case, the two signals
would be completely different, even though both measure gating
events. Another example is shown in Figure 11, where the
gating charge position at
![]() 120 mV
shows a smaller change than the fluorescence, when compared with a
pulse to 30 mV.
120 mV
shows a smaller change than the fluorescence, when compared with a
pulse to 30 mV.
|
1. Probes indicate local changes
The site-directed fluorescence labeling technique was applied by Cha and Bezanilla (
19) in an attempt to understand the relationship of different parts of the Shaker K channel molecule with respect to its function. These authors measured fluorescence changes in oocytes under voltage clamp using the cut-open oocyte technique that allows faster membrane potential control than the two-microelectrode technique. Cysteines were introduced in the S1-S2 loop, the S3-S4 loop, the S4 segment, and the external face of the pore region, and the fluorescence signal from each one of those sites was compared with gating or ionic currents. The signals from sites near the S2 and S4 segments followed the charge movement voltage dependence, whereas the sites in the pore followed the voltage dependence of the conductance.A) S2 AND S4. The details of the kinetics of
fluorescence of the same sites near and in the S4 segments explored by Mannuzzu
et al. (58) (M356C and A359C) were studied by Cha and
Bezanilla (19), and they found that the time
courses of the charge position and the fluorescence did not match. By
fitting sum of exponentials to the fluorescence and charge position
recordings as a function of voltage, it was found that one of the
kinetic components had the same time constant and voltage dependence
in both types of recordings, whereas other kinetic components were
very different. This implied that the normalized plot of the F-V
and Q-V curves only matched at certain durations of
pulses but even the best match (400-ms pulse) diverged completely at
potential more negative than
![]() 100 mV for
A359C. This is because in that mutant the F-V curve reached a
minimum at
100 mV for
A359C. This is because in that mutant the F-V curve reached a
minimum at ![]() 100
mV. This result is not surprising because a particular position such
as A359C would not be expected to undergo a monotonic change in
environment, and thus it would reflect just one aspect of the gating
process.
100
mV. This result is not surprising because a particular position such
as A359C would not be expected to undergo a monotonic change in
environment, and thus it would reflect just one aspect of the gating
process.
A comparison of the time courses of fluorescence and charge position was done
at T276C, which lies close to the S2 segment, and M356C, which lies
close to the S4 segment. Figure 12 shows the
comparison of fluorescence traces and charge position traces for
voltages ranging from
![]() 50 to +20
mV. The fluorescence is scaled to coincide with the gating charge at
the end of the pulse, and it is clear that the F(t) trace is
faster than the Q(t) for the S2 position (Fig.
12C, left) and slower for the S4 position (Fig.
12C, right). The best agreement for the
S2 position occurs at very hyperpolarized potentials, a region where
most of the faster Q1 charge moves (see Fig.
5 and sect. IIID and Bezanilla
et al., Ref. 13). The F(t) curves
approaches the Q(t) curve in the S4 position at more
depolarized potentials, where most of the slower Q2
charge moves. It is tempting to conclude that most of the Q1
is related to an S2 segment conformational change, whereas Q2
is related to an S4 conformational change. However, it is always
possible that the quenching mechanism of position T276C is not
directly related to a movement of the S2 segment but is produced, for
example, by a nearby conformational change of the S3-S4 linker that
may be detected at that position. Further probes in the S2 segment
may help to pinpoint where the fast early changes in gating actually
occur.
50 to +20
mV. The fluorescence is scaled to coincide with the gating charge at
the end of the pulse, and it is clear that the F(t) trace is
faster than the Q(t) for the S2 position (Fig.
12C, left) and slower for the S4 position (Fig.
12C, right). The best agreement for the
S2 position occurs at very hyperpolarized potentials, a region where
most of the faster Q1 charge moves (see Fig.
5 and sect. IIID and Bezanilla
et al., Ref. 13). The F(t) curves
approaches the Q(t) curve in the S4 position at more
depolarized potentials, where most of the slower Q2
charge moves. It is tempting to conclude that most of the Q1
is related to an S2 segment conformational change, whereas Q2
is related to an S4 conformational change. However, it is always
possible that the quenching mechanism of position T276C is not
directly related to a movement of the S2 segment but is produced, for
example, by a nearby conformational change of the S3-S4 linker that
may be detected at that position. Further probes in the S2 segment
may help to pinpoint where the fast early changes in gating actually
occur.
|
B) THE PORE. Position T449 has been implicated in binding of external TEA (57) and in slow inactivation (55). The voltage dependence of fluorescence changes of Oregon green attached to position T449C follows the voltage dependence of the conductance rather than gating charge (19). This result is in line with the idea that fluorescent probes show local changes in environment, making them extremely useful to detect local conformational changes. Application of external TEA eliminated the ionic currents, but the fluorescence changes were maintained, showing that the fluorescence changes were not the result of ion flow. Analysis of the fluorescence change kinetics revealed a fast component that roughly follows the time course of activation and a slower component that seems to relate to the onset of slow inactivation. It is interesting, however, that the time course of fluorescence during deactivation is slower than the activation of the conductance, indicating that the fast event that closes the channel is occurring in another region (most likely on the inside, see Perozo et al., Refs. 71, 72) and that the external part of the pore undergoes subsequent conformational changes.
2. Mechanisms of fluorescence changes
The next issue was to explore whether the changes in fluorescence of A359 and M356 were in fact produced by a change in hydrophobicity seen by the probe. A marker of changes in hydrophobicity is a shift in the emission spectrum of the fluorophore, which was verified experimentally by Cha and Bezanilla (
19) for TMRM in solution. The experimental setup had attached a spectrograph and a charge-coupled device camera that allowed the recording of the emission spectra directly from the oocyte surface under voltage clamp. The intensity was changed without affecting the wavelength dependence of the peak of the spectra. This result indicates that the voltage-dependent fluorescence changes seen by the probes attached near or in the S4 segment are the result of a change in quenching and not due to a change in hydrophobicity. The mechanism of quenching was further explored using collisional quenchers and anisotropy measurements in a subsequent publication (20). Two quenchers were explored: the anion iodide and D2O. Both quenchers had effects on positions M356 and A359 at all voltages, indicating that TMRM attached to these sites is always exposed to a water-filled environment, consistent with the spectral measurements. By varying the external pH, a modulation of the quenching was found for M356C and A359C that was not explained by surface charge titration. All these results pointed to a common mechanism of fluorescence change in residues near and in the S4 segment based on quenching of the fluorophore by nearby residues of the protein, some of which were affected by pH.A different mechanism of fluorescence quenching was found at position D270C, which is located in the extracellular part of the S2 segment. In this case, the fluorescence signal reversed its direction depending on the excitation wavelength. This is expected if the excitation spectrum of the dye is shifted by the voltage change or the concomitant conformational change.
3. Anisotropy and quenching studies delineate the environment around S4
Anisotropy is a measure of the rotational freedom of the fluorophore during its excited-state lifetime. If the fluorophore is close to and interacts with nearby residues, it is expected that its anisotropy would change if the positions of those residues are modified by voltage. By studying the anisotropy of TMRM attached to three sites, M356C, A359C, and V363C, a pattern emerged: the deeper into the S4, the less the anisotropy. In addition, the voltage modulates the anisotropy of these sites such that a depolarization increases the anisotropy at position M356C and decreases it for positions A359C and V363C. This would indicate that position M356C gets more constrained upon depolarization, whereas A359C and V363C become less constrained. This result is in agreement with the accessibility of collisional quenchers because, although positions M356C and A359C are always accessible to D2O, depolarization increases A359C accessibility and decreases M356C accessibility. Iodide has access to both sites, but it has increased the accesibility to M356C during depolarization, a result that seems contradictory to the D2O accessibility. However, because iodide is negatively charged, its accessibility is also governed by electrostatics, and it is possible that at positive potentials M356C goes into a restricted space that is lined by positively charged residues. A general picture of the surroundings of the linker near the S4 segment can be constructed with these results (
20), and it is schematically shown in Figure 13. In this scheme, at hyperpolarized potentials A359 and M356 lie in a water-filled crevice with nearby negative charges, which can be titrated at low pH, and modulate the quenched state of a fluorophore at this position. Upon depolarization, A359 moves away from the negative residues and accessibility increases while M356 moves closer to positively charged residues which increase its anisotropy and increase the local concentration of iodide. Sorensen et al. (91) have studied the fluorescence of TMRM attached to M356C and A359C on a mutant that has the S3-S4 linker reduced from 31 to only the 5 amino acids closest to the S4 segment (37). This 5-amino acid linker channel shows a 10-fold decrease in the fluorescence signal for M356C and is no longer titratable by pH. It is interesting to note that in this mutant the four acidic residues that normally are close to S3 are now removed, indicating that part of the protein-lined vestibule of Figure 13 is made up by the S3-S4 linker. The positive charge interacting with M356 could be residue K427 that is in the turret of the pore (56) and may explain why in the 5-amino acid linker channel the fluorescence of TMRM attached to M356C tracks slow inactivation (91), which has been shown to be modulated by the external part of the pore.
|
4. Fluorescence changes near the S4 segment are modulated by the pore
When a comparison was made between the fluorescence signal of M356C or A359C in the nonconducting (W434F) as opposed to the conducting channel with a pore mutation (T449Y), significant differences were found. This was somewhat surprising if one thinks that the properties of the sensor do not depend on whether the channel is conducting ions. We decided to explore this interaction in more detail by comparing the fluorescence signals of M356C and T449Y when the pore is open as opposed to a blocked pore either with external TEA or agitoxin (
20). Figure 14 shows the fluorescence changes of M356C in the conducting T449Y channel in the presence and absence of agitoxin. Notice that the fluorescence quenching is increased in the presence of agitoxin and that the voltage dependence of the fluorescence is different at potentials more positive than
|
5. Fluorescence reveals specific functions of different domains of the Na channel
The involvement of all domains of the Na channel has been implicated in inactivation by mutagenesis studies combined with electrophysiology (
23, 26, 46). Because inactivation is coupled to activation, it is difficult to infer functional roles of specific domains by observing the effects of a particular mutation on ionic currents. The signal of fluorescent probes gives indication of local changes, which gives the opportunity to use site-directed fluorescence labeling to pinpoint the roles of each domain in inactivation.In the case of the Shaker K channel, a cysteine mutation used to
attach the fluorophore will produce four cysteines, and four
fluorophores may become attached to the molecule due to the tetrameric
structure of the channel. In the case of the Na channel, because
the domains (which are equivalent of the K channel subunits, see
Fig. 2) are strung together in one molecule, it makes it
possible to test the function of each of the domains separately, by
introducing cysteine mutations in each domain individually. The
technique of site-directed fluorescent labeling was applied by Cha et
al. (21) to the skeletal muscle Na channel (HSkM1)
with the idea of investigating the roles of different domains of the
channel in the conformational changes associated with inactivation.
As we described in section IIIH, gating
current of the Na channel is immobilized by inactivation. This
immobilization becomes evident during repolarization after a
depolarizing pulse that has been sufficiently positive and long
enough to induce fast inactivation. Thus repolarization after short
pulses that do not induce inactivation shows gating charge return in
a single fast component, whereas repolarization after long pulses,
which have induced inactivation, shows a fast and a slow component in
the return of the charge. The slow component is the return of the
immobilized charge (see Fig. 7). In the original
experiments done in the squid axon, the slow component becomes so
slow at ![]() 70
mV that it is not detectable (hence the name of immobilized charge,
Armstrong and Bezanilla, Ref. 7), but it becomes
faster at
70
mV that it is not detectable (hence the name of immobilized charge,
Armstrong and Bezanilla, Ref. 7), but it becomes
faster at ![]() 150
mV and its time course corresponds to the time course of recovery
from inactivation. Although the inactivation produces a complete
block of the ionic current, the immobilizable charge is only
two-thirds of the total charge, raising the question of whether the
two-thirds of immobilized charge is a property of each one of the
four S4 segments of the molecule or if there is full immobilization
in some of them and none in the others. This is precisely a question
that could be answered using site-directed fluorescence labeling
because the changes in fluorescence indicate local conformational
changes.
150
mV and its time course corresponds to the time course of recovery
from inactivation. Although the inactivation produces a complete
block of the ionic current, the immobilizable charge is only
two-thirds of the total charge, raising the question of whether the
two-thirds of immobilized charge is a property of each one of the
four S4 segments of the molecule or if there is full immobilization
in some of them and none in the others. This is precisely a question
that could be answered using site-directed fluorescence labeling
because the changes in fluorescence indicate local conformational
changes.
The proportion of the maximum immobilizable charge to total charge was verified to also be two-thirds in the human skeletal muscle Na channel, and the time course of immobilization followed the time course of inactivation. The question then asked was which S4 was responsible for that immobilization. The logic of the experiments was to label each one of the four S4 segments, one at a time, with a fluorescent probe and look for changes in fluorescence that could be related to the settling and recovery from inactivation. The fluorescence kinetics followed the time course of activation and deactivation when the fluorophore was attached to the S4 segment of domain I or domain II (see Fig. 15, A-C) showing no component that had the time course of inactivation. Furthermore, a depolarizing prepulse that produced inactivation had no effect on the fluorescence signal during the test pulse, as if charge immobilization had no influence in the movements detected near the S4 of domains I and II. A different result was obtained in domains III and IV. In the case of domain III, a component of the fluorescent signal followed the time course of inactivation, superimposed on the activation time course. Also, deactivation of the fluorescence signal in domain III was preceded by a delay for pulses that developed inactivation, and a prepulse experiment abolished a large fraction of the fluorescence signal. In domain IV, the effects were even more pronounced than in domain III, and the inactivation had a clear correlate with the fluorescence signal during activation. The deactivation kinetics time course also became slower as the inactivation during the pulse settled (see Fig. 15, D-F) and the prepulse experiment abolished the fluorescence signal completely. These results indicate that charge immobilization is the result of S4 immobilization of domain III and IV but not I and II, giving the molecular basis for the nonimmobilizable component (domains I and II) and the immobilizable component (domains III and IV) of the gating charge. The involvement of domains III and IV has also been shown by mutagenesis and electrophysiological studies (26, 60, 89).
|
During the operation of the Na channel, depolarization moves all four S4 voltage sensors to their active position. The channel opens and the inactivating particle can now swing into position to inactivate the ionic current. After inactivation is settled, a repolarization allows the return to the resting position of the gating charge carried by the S4 segments of domains I and II, which is the nonimmobilizable component of the charge. The S4 segments of domain III and IV cannot go back until the inactivation particle dissociates from the domain; this process constitutes the immobilizable fraction of the gating charge which moves slowly back as the particle dissociates. This means that about two-thirds of the charge is carried by domains III and IV and the other third is carried by domains I and II. It is interesting to note that there are more basic residues in domains III and IV than in domains I and II, but a direct correlation of the charge per domain cannot be assessed until charge per channel is measured in neutralization mutants. Thus, in the Na channel, the four domains do not behave equally and, in the case of inactivation, the inactivating particle interacts with the S4 segment of domains III and IV but fails to affect domains I and II.
This technique could also be used to determine whether the four domains proceed in orderly fashion during activation or during deactivation in the absence of inactivation. For example, if one of the domains always moves after the others, the fluorescence signal from that domain should show delay proportional to the time it takes for the other domains to move. These experiments must be done at low temperatures to increase the time resolution of the system and in principle could be used to assign domains to specific kinetic steps of activation and deactivation.
E. Distance Measurements in the Channel Using Fluorescence Resonance Energy Transfer and Lanthanide-Based Resonance Energy Transfer
Exposure of histidine or cysteine and fluorescence changes provide information on local conformational changes but do not give information on actual changes in distance between residues. The first attempts at distance measurements have been done using fluorescence resonance energy transfer (FRET) and lanthanide-based resonance energy transfer (LRET) (
22). The FRET technique has been used extensively, and many reviews have appeared (i.e., Refs. 17, 82). The basic idea is to label two sites with two different fluorophores, a donor and an acceptor, and measure the transfer of energy between the donor and acceptor, which is inversely proportional to the sixth power of the distance between donor and acceptor molecules.1. Basic theory of the measurements
We review here only briefly to account for the type of measurements done with LRET. According to the theory of singlet-singlet energy transfer developed by Forster (see Ref.
17), the distance R between donor and acceptor is given by|
|
(16) |
where E is the fraction of donor excited states transferring energy to the
acceptor, or the efficiency of energy transfer. R0
is the distance for 50% transfer, which is characteristic of each
donor-acceptor pair and given (in Angstroms) by
|
|
(17) |
where JD is the normalized spectral overlap between donor
emission and acceptor absorption, qD is the donor quantum
yield, n is the index of refraction, and
![]() 2
is a geometric factor that is related to the relative orientation of
the donor and acceptor transition dipoles. E can be estimated in
several ways. One is to measure lifetimes as
2
is a geometric factor that is related to the relative orientation of
the donor and acceptor transition dipoles. E can be estimated in
several ways. One is to measure lifetimes as
|
|
(18) |
where ![]() DA
is the time constant of the donor in presence of the acceptor and
DA
is the time constant of the donor in presence of the acceptor and
![]() D
is the time constant of the donor in absence of the acceptor. In
FRET, two organic fluorophores are normally used. The lifetimes of
these dyes are in the nanosecond range, which makes the measurement
of transfer by lifetimes difficult. The stoichiometry in FRET must
also be accurately known to measure a reliable distance. This makes
the experiment of mixing donor and acceptor uninterpretable. In
addition, the orientation factor
D
is the time constant of the donor in absence of the acceptor. In
FRET, two organic fluorophores are normally used. The lifetimes of
these dyes are in the nanosecond range, which makes the measurement
of transfer by lifetimes difficult. The stoichiometry in FRET must
also be accurately known to measure a reliable distance. This makes
the experiment of mixing donor and acceptor uninterpretable. In
addition, the orientation factor
![]() 2
and qA must be determined for each site in the study to obtain
accurate distances. All these problems make FRET better for obtaining
relative distances as opposed to absolute distances, and it lends
itself to measuring changes in distance from two sites under the
influence of a perturbation, such as voltage. However, even in
this case, one must determine that
2
and qA must be determined for each site in the study to obtain
accurate distances. All these problems make FRET better for obtaining
relative distances as opposed to absolute distances, and it lends
itself to measuring changes in distance from two sites under the
influence of a perturbation, such as voltage. However, even in
this case, one must determine that
![]() 2
and qA are not responsible for artifactual changes during the
perturbation, which could lead to erroneous interpretations of
distance changes. In contrast, LRET (see Selvin, Ref. 82)
uses a donor based on a lanthanide, such as europium or terbium,
which has a lifetime in the millisecond range. The lanthanide is in
a complex that binds the lanthanide tightly, removes the water
molecules (which normally quench its fluorescence), allows the
attachment of an antenna that transfers energy to the lanthanide, and
provides a handle to attach it to the channel (in this case to a Cys
through a maleimide group). Strictly speaking, lanthanides should not
be called fluorescent but luminescent. The emission is unpolarized,
which restricts the
2
and qA are not responsible for artifactual changes during the
perturbation, which could lead to erroneous interpretations of
distance changes. In contrast, LRET (see Selvin, Ref. 82)
uses a donor based on a lanthanide, such as europium or terbium,
which has a lifetime in the millisecond range. The lanthanide is in
a complex that binds the lanthanide tightly, removes the water
molecules (which normally quench its fluorescence), allows the
attachment of an antenna that transfers energy to the lanthanide, and
provides a handle to attach it to the channel (in this case to a Cys
through a maleimide group). Strictly speaking, lanthanides should not
be called fluorescent but luminescent. The emission is unpolarized,
which restricts the
![]() 2
to 1/3 to 4/3 (in FRET, it can range from 0 to 4) and maximum error
in distances are estimated at ±11%. The lanthanides also have sharply
spiked regions in the spectrum that make excellent overlap with
acceptors with totally dark regions in between. The time constant of
the acceptor that receives energy from the donor, otherwise known as
sensitized emission, is the same as
2
to 1/3 to 4/3 (in FRET, it can range from 0 to 4) and maximum error
in distances are estimated at ±11%. The lanthanides also have sharply
spiked regions in the spectrum that make excellent overlap with
acceptors with totally dark regions in between. The time constant of
the acceptor that receives energy from the donor, otherwise known as
sensitized emission, is the same as
![]() AD.
The sensitized emission can easily be measured in absence of donor
emission because of the spectral gaps, and the direct acceptor
emission is also eliminated because the acceptor has nanosecond
lifetimes and the measurements are done in the millisecond range. In
the actual LRET experiment, one measures the decay of the light
emission for the donor only and then the donor in the presence of
acceptor and uses Equation 18 to estimate
E. Alternatively, one can measure donor only lifetime (
AD.
The sensitized emission can easily be measured in absence of donor
emission because of the spectral gaps, and the direct acceptor
emission is also eliminated because the acceptor has nanosecond
lifetimes and the measurements are done in the millisecond range. In
the actual LRET experiment, one measures the decay of the light
emission for the donor only and then the donor in the presence of
acceptor and uses Equation 18 to estimate
E. Alternatively, one can measure donor only lifetime (![]() D)
and sensitized emission lifetime (
D)
and sensitized emission lifetime (![]() AD)
and compute the energy transfer as
AD)
and compute the energy transfer as
|
|
(19) |
All these measurements are lifetimes, which do not require a normalization of intensities. For all these advantages, LRET is much preferred over FRET and has been used by Cha et al. (22) to measure absolute distances and changes in distance with voltage in the Shaker K channel.
2. LRET measurements on intersubunit distances
In a K channel, one mutation will appear as four repeats in the final molecule; therefore, by labeling with a mix of donors and acceptors, one obtains a variable stoichiometry, and interpretation would be impossible in the case of FRET. However, if the labeling is done with an excess of lanthanide donor, on the average there are several donors per acceptor in each channel molecule, and it is still possible to use the same equations to compute distances after measuring lifetimes. This is because the lifetime of the acceptor (fluorescein, for example) is so short compared with the terbium chelate that it can sample multiple donors independently.
The experiments by Cha et al. (
22) were done as follows. Expressing oocytes containing a site-directed Cys were stained with a mixture of lanthanide chelate and fluorescein in a four to one ratio and then mounted on an inverted cut-open oocyte chamber. Lifetimes were measured using pulses of different voltages and steady holding potentials. To obtain the lifetime of donor only, oocytes were stained with donor only, and the same measurements were repeated. The interpretation of these results is again based on the computation of E and then the estimation of R. In this case, the R measurements should reflect the distance between subunits for the site in study. The lifetimes are expected to reflect the distance between contiguous subunits and across the pore, which assuming tetrameric symmetry will be related by the Pythagorean theorem. Cha et al. (22) measured energy transfer for several sites near the S2 segment, near the S4, in the S4 segment and in the pore. The results showed two time constants in the lifetimes of the sensitized emission for all the sites tested, and from those lifetimes two distances were computed that were in fact related to each other by the Pythagorean theorem. The distance estimated across the pore for position F425, which lies in the outer pore region of the Shaker K channel, agreed to within 1 Å with the distance measured for position Q58 from the crystal structure of the KcSa bacterial channel (32). Position F425 in Shaker K channel is equivalent to position Q58 of the KcSa channel according to the toxin binding studies by MacKinnon et al. (56).The LRET technique applied to the cut-open oocyte clamp also allowed the measurement of distances under voltage clamp. Cha et al. (22) studied energy transfer as a function of membrane potential by applying pulses and recording the lifetimes of the sensitized emission 50 ms after the initiation of the pulse to allow gating current to subside and the channel to reach its new equilibrium position. The tested site in S4 did not show changes in distance with voltage (V363C), but three sites in the linker between S3 and S4 showed distance changes with voltage. This is the first report of an actual distance change as a consequence of a change in voltage, and it matches the characteristics of the electrical motion of the voltage sensor. It is important to note that the distance measurements obtained with this technique of multiple staining with donor and acceptor only detect distance changes if the radial distance between the site and the center of the channel molecule is modified. Therefore, if the site in question changes its position with voltage but maintains the same radial distance, no distance changes would be measured. However, the technique can detect movement of the site perpendicular to the plane of the membrane when the subunits are not all in symmetrical position. If we assume that the movement of the sites is completely perpendicular to the membrane, at rest (very hyperpolarized) and in the fully activated position (very depolarized), the distances measured would be the same. However, at intermediate potentials, when one or more of the subunits are activated while others are still in the resting state, there will be a change in the effective distance between them that should be reflected in a maximum of the distance versus voltage curve. Cha et al. (22) did not find any site that showed those features, making it unlikely that the movement of the voltage sensor occurs as a translation perpendicular to the membrane (33).
The largest change in distance (~3 Å) was observed in position 346, which is
about halfway between S3 and S4. The distance increased with
depolarization and followed a sigmoid curve with voltage that could
be fitted by a sequential three-state relation with parameters almost
identical to the gating charge movement. In addition, position
351 showed an increase in distance with depolarization, position
352 showed no change, and position 353 showed a decrease in distance.
One possible interpretation of this result is that the S4 segment and
the extracellular amino acids near S4 undergo a rotation with
voltage. If this region is
![]() -helical,
then one site can rotate to the opposite side of the helix and
maintain the same distance to center of the channel, while the
residue preceding it will increase its distance and the one following
it will decrease its distance with respect to the center.
-helical,
then one site can rotate to the opposite side of the helix and
maintain the same distance to center of the channel, while the
residue preceding it will increase its distance and the one following
it will decrease its distance with respect to the center.
| |
V. STRUCTURAL CHANGES AND MODELS OF ACTIVATION |
|---|
|
|
|---|
A. Voltage Sensor: a Model of Operation
To conclude, we may summarize the main facts about structure-function relation of the voltage sensor and at the same time propose a physical model that can account for the functional and structural data. A total of ~13 e0 constitutes all the essential charge necessary to open the Shaker K channel. The histidine-scanning mutagenesis indicates that the first four most extracellular basic residues of the S4 segment move from an accessible position from the intracellular medium to another accessible position in the extracellular medium, accounting for the total charge per channel. Acidic residues in S2 and perhaps S3 seem to participate in shaping the electric field seen by the moving basic residues in the S4 segment.
Taking as a basic building block the crystal structure of the KcSa bacterial channel (
32), it is possible to build a model that can account qualitatively for the structural and functional observations on the Shaker K channel. Such a model is presented in Figure 16. In this arrangement, the conducting pore structure is shown as the S5 and S6 segments for noncontiguous subunits. This view has the advantage that the subunit on the right shows the back of the subunit on the left. The lining of the internal water-filled crevice is made up by S1 and S5 forming an inverted "V" that communicates to the intracellular medium while the lining of the external crevice is formed by segments S2 and S3 in a "V" fashion. The S4 segment is located between these two crevices. Yellen (114) has also proposed crevices formed by other segments tilted against the S4 segment. At hyperpolarized potentials, the first four basic residues are located in the intracellular crevice, while the next residues are in a region of the extracellular crevice assumed to be hydrophobic and not in continuity with the extracellular medium (see Fig. 16, top). Upon depolarization, the electric field acts on the charges facing the inside (the crevice is not isopotential) and forces the S4 segment to move toward the outside. As this movement is constrained, the segment rotates (180°) and tilts a little, exposing the basic residues to the outside crevice and transporting ~13 e0 in the process (see Fig. 16, bottom). This rotation and tilt of the S4 segment would pull on the intracellular side of the S5 segment by way of the S4-S5 linker (see Fig. 16), which would rotate and pull apart the intracellular portion of the S6 segment. This would open the channel in a manner similar to the proposed gating of the KcSa channel (71, 72).
|
This model accounts for many of the observations we have reviewed here. The fifth charge (K374, see Fig. 2) is close to E293 and D316 in the closed position, satisfying the charge network found by Papazian et al. (69). Also, in the open state, position E283 is close to the third and fourth charges (R368 and R371), satisfying the other charge network (103) and explaining the enhancement of the proton transport by R371H when E283 is present (93). Position E283 is permanently exposed into the outside crevice, as found by Tiwari-Woodruff et al. (103). The general arrangement of the segments of the model shown in Figure 16 is also in agreement with a recent work by Monks et al. (61) using tryptophan replacement in S2 to pinpoint the impact on channel-gating properties. They located one face of S2 toward the bilayer and the rest facing the inside of the protein. That same work proposed that S1 is also located toward the periphery of the protein, whereas S3 is more buried into the protein.
The rotation of the S4 segment was proposed mainly to satisfy the results of LRET for positions 351, 352, and 353 (Ref. 22; see sect. IVE) with the assumption that the S4 segment is rigidly connected to those residues. The larger distance change observed in position S346 could be explained by two different mechanisms. If upon depolarization the S4 segment with extension up to residue S346 tilts with a pivot point near the intracellular side (Fig. 16), then the movement of S346 should be larger than 351 or 353, and these sites would exhibit larger movements than any of the other residues deeper into the S4 segment. The other possibility is that the linker between S3 and S4 does not simply extend above S4 but has a bend or kink that would amplify any rotation of the S4 segment.
The actual rotation of the S4 segment may occur in more than one step (9, 91). In starting the rotation, the first charge that would exit the crevice would be R362, which is in the crevice's narrowest point. Depending on the degree of tilt of S4 and the hydrophobic profile of the S5-lined crevice, the second charge may be R365 or R371, followed by R368 (see Fig. 16). The gating current noise analysis (see sect. IIIC) indicates that a large shot of charge occurs toward the end of the activation sequence, so the last step must move ~2.4 e0. This could be possible if three of the charges make the last step in the rotation.
If the rotation is the only conformational change that occurs in transferring the charge, a prediction is that the residues on the back side of the helix should exhibit voltage-dependent exposure reversed with respect to the charges. Yang et al. (111) have studied the accessibility of the two hydrophobic residues in between the second and third charge of the S4 segment in the fourth domain of the human skeletal muscle Na channel. They found that they are never accessible from the outside. It is expected that the residues in the crevice opposite to where the charges are would be hydrophobic and the reagents may not reach the sites. However, those two residues were found to be accessible from the inside at hyperpolarized potentials, which is not in agreement with a simple rotation. The results of the Na channel accessibility and of Shaker accessibility (115) imply that some other conformational changes are occurring, such as a change of tilt, a small translation, or movement of the side chains of the neighboring segments in addition to the simple rotation pictured in Figure 16. For example, in the hyperpolarized condition, the S4 segment would lie in front of the boundary between S5 and S1 shown in the top part of Figure 16 exposing the charges and the back residues to the interior. Upon depolarization, the S4 segment would cross this boundary to expose the top part of the segment to the extracellular medium, as shown in Figure 16.
The role of residues E293 and D316 in the charge movement is not explicitly considered in the model of Figure 16. These acidic residues may be responsible for shaping the field at the bottom of the external crevice or, in fact, may be moving carrying the S2 and/or the S3 segments with them. It is still unclear whether part of the Q1 charge may be carried by these acidic residues. Future experiments on histidine scanning may resolve this issue.
B. Concluding Remarks
It is fascinating how evolution has solved the problem of voltage sensing by locating permanently charged amino acids of the protein in contact with the conducting medium penetrating the core of the protein. This allows the movement of a very large charge across the electric field, which is required for a very steep voltage dependence, without the need of a large conformational change in the channel structure.
The information obtained from accessibility and fluorescence labeling combined with the detailed information given by electrophysiology has given us a preliminary physical model of the changes in conformation leading to channel opening. These types of models are still quite rough, but they serve as a working hypothesis to test new results of structure and function. We expect that in the near future, site-directed fluorescence labeling, more accessibility studies, and site-directed measurements of distances using FRET and LRET techniques should provide us with a more complete picture of the conformational changes leading to activation. The refinement of the activation steps may come from the study of gating current noise as a function of voltage using voltage ramps (
87) or by analyzing the gating current noise with complex pulse protocols that isolate particular steps of the activation, or after neutralization of basic groups involved in gating. These studies may be extended to the single-channel level using fluorescent probes as markers of the sensor motion. This would allow the correlation of the individual shots, indicated by light, with channel opening. In addition, the study of site-directed fluorescence labels in selected positions of the S2, S3, and S4 segments with pulse protocols that can isolate the different components of gating may yield the contributions of individual residues to the different steps of gating. The techniques of fluorescence labeling and LRET may be extended to internal sites of the channel, allowing the measurement of conformational changes in the intracellular face of the channel and thus uncover the details of the coupling between the sensor and the gate. All these techniques combined with the eventual crystal structure of a six-transmembrane segment channel should give a solid basis to develop an atomic-level account of the structural changes during the operation of the voltage sensor that would finally bridge the gap between purely kinetic models and a detailed physical model of the channel.| |
ACKNOWLEDGMENTS |
|---|
I give special thanks and recognition to the late Dr. Robert E. Taylor from whom I learned much and especially how to relate experimental work to physical theory. I am grateful to Albert Cha, Drs. Enrico Stefani, Dorine Starace, and Dan Sigg for reading and commenting on earlier versions of this review.
This work was supported by National Institute of General Medical Sciences Grant GM-30376 and by funds from the S. Hagiwara chair.
| |
FOOTNOTES |
|---|
Address for reprint requests and other correspondence: F. Bezanilla, Dept. of Physiology, Univ. of California at Los Angeles, School of Medicine, Los Angeles, CA 90095 (E-mail: fbezanil@ucla.edu ; web site: http://pb010.anes.ucla.edu).
| |
REFERENCES |
|---|
|
|
|---|
| 1. | AGGARWAL, S. K., AND R. MacKINNON. Contribution of the S4 segment to gating charge in the Shaker K+ channel. Neuron 16: 1169-1177, 1996[ISI][Medline]. |
| 2. | AKABAS, M. H., D. A. STAUFFER, M. XU, AND
A. KARLIN. Acetylcholine receptor channel structure probed in cysteine-substitution
mutants. Science 258: 307-310, 1992 |
| 3. | ALDRICH, R. W., D. P COREY, AND C. F. STEVENS. A reinterpretation of mammalian sodium channel gating based on single channel recording. Nature 306: 436-441, 1983[ISI][Medline]. |
| 4. | ALDRICH, R. W., AND C. F. STEVENS. Voltage-dependent gating of single sodium channels from mammalian neuroblastoma cells. J. Neurosci. 7: 418-431, 1987[Abstract]. |
| 5. | ALMERS, W. Gating currents and charge movements in excitable membranes. Rev. Physiol. Biochem. Pharmacol. 82: 96-190, 1978[Medline]. |
| 6. | ARMSTRONG, C. M., AND F. BEZANILLA. Currents related to movement of the gating particles of the sodium channels. Nature 242: 459-461, 1973[ISI][Medline]. |
| 7. | ARMSTRONG, C. M., AND F. BEZANILLA. Inactivation of the sodium channel. II. Gating current experiments. J. Gen. Physiol. 70: 567-590, 1977[Abstract]. |
| 8. | ARMSTRONG, C. M., F. BEZANILLA, AND E. ROJAS. Destruction of sodium conductance inactivation in squid axons perused with pronase. J. Gen. Physiol. 62: 375-391, 1973[Abstract]. |
| 9. | BAKER, O. S., H. P. LARSSON, L. M. MANNUZZU, AND E. Y. ISACOFF. Three transmembrane conformation and sequence-dependent displacement of the S4 domain in Shaker K+ channel gating. Neuron 20: 1283-1294, 1998[ISI][Medline]. |
| 10. | BEZANILLA, F. Gating of sodium and potassium channels. J. Membr. Biol. 88: 97-111, 1985[ISI][Medline]. |
| 11. | BEZANILLA, F., AND C. M. ARMSTRONG. Inactivation of the sodium channel. I. Sodium current experiments. J. Gen. Physiol. 70: 549-566, 1977[Abstract]. |
| 12. | BEZANILLA, F., E. PEROZO, D. M. PAPAZIAN,
AND E. STEFANI. Molecular basis of gating charge immobilization in
Shaker potassium channels. Science 254: 679-683, 1991 |
| 13. | BEZANILLA, F., E. PEROZO, AND E. STEFANI. Gating of Shaker K channels. II. The components of gating currents and a model of channel activation. Biophys. J. 66: 1011-1021, 1994[Abstract]. |
| 14. | BEZANILLA, F., AND E. STEFANI. Gating of the Shaker B potassium channel. In: Basic Neuroscience in Invertebrates, edited by H. Koike, Y. Kidokoro, K. Takahashi, and T. Kanaseki. Tokyo: Japan Scientific Soc., 1996. |
| 15. | BEZANILLA, F., AND R. E. TAYLOR. Voltage-dependent gating of sodium channels. In: Abnormal Nerve and Muscle as Abnormal Impulse Generators, edited by W. Culp, and J. Ochoa. New York: Oxford Univ. Press, 1982, p. 62-79. |
| 16. | BEZANILLA, F., M. M. WHITE, AND R. E. TAYLOR. Gating currents associated with potassium channel activation. Nature 296: 657-659, 1982[ISI][Medline]. |
| 17. | CANTOR, C. R., AND P. R. SCHIMMEL. Biophysical Chemistry. Part II. Techniques for the Study of Biological Structure and Function. New York: Freeman, 1980. |
| 18. | CATTERALL, W. A. Molecular properties of voltage-sensitive sodium channels. Annu. Rev. Biochem. 55: 953-1021, 1996[ISI][Medline]. |
| 19. | CHA, A., AND F. BEZANILLA. Characterizing voltage-dependent conformational changes in the Shaker K+ channel with fluorescence. Neuron 19: 1127-1140, 1997[ISI][Medline]. |
| 20. | CHA, A., AND F. BEZANILLA.
Structural implications of fluorescence quenching in the Shaker K+
channel. J. Gen. Physiol. 112: 391-408, 1998 |
| 21. | CHA, A., P. C. RUBEN, A. L. GEORGE, E. FUJIMOTO, AND F. BEZANILLA. Voltage sensors in domains III and IV, but not I and II, are immobilized by Na channel fast inactivation. Neuron 22: 73-87, 1999[ISI][Medline]. |
| 22. | CHA, A., G. E. SNYDER, P. R. SELVIN, AND F. BEZANILLA. Atomic scale movement of the voltage-sensing region in a potassium channel measured via spectroscopy. Nature 402: 813-817, 1999[ISI][Medline]. |
| 23. | CHAHINE, M., A. L. GEORGE, JR., M. ZHOU, S. JI, W. SUN, R. L. BARCHI, AND R. HORN. Sodium channel mutations in paramyotonia congenita uncouple inactivation from activation. Neuron 12: 281-294, 1994[ISI][Medline]. |
| 24. | CHAPMAN, M. L., H. M. A. VANDONGEN, AND M. J. VANDONGEN. Activation-dependent subconductance levels in the drk1 K channel suggest a subunit basis for ion permeation and gating. Biophys. J. 72: 708-719, 1997[Abstract]. |
| 25. | CHEN, F. S. P., D. STEELE, AND D.
FEDIDA. Allosteric effects of permeating cations on gating currents during K+
channel deactivation. J. Gen. Physiol. 110: 87-100, 1997 |
| 26. | CHEN, L.-Q., V. SANTARELLI, R. HORN, AND R. G. KALLEN. A unique role for the S4 segment of domain 4 in the inactivation of sodium channels. J. Gen. Physiol. 108: 549-556, 1996[Abstract]. |
| 27. | COLE, K. S., AND J. W. MOORE. Potassium ion current in the squid giant axon: dynamic characteristics. Biophys. J. 1: 1-14, 1960[ISI][Medline]. |
| 28. | CONTI, F., AND W. STUHMER. Quantal charge redistribution accompanying the structural transitions of sodium channels. Eur. Biophys. J. 17: 53-59, 1989[ISI][Medline]. |
| 29. | CORREA, A. M., F. BEZANILLA, AND R. LATORRE. Gating kinetics of batrachotoxin-modified Na channels in the squid giant axon. Voltage and temperature effects. Biophys. J. 61: 1332-1352, 1992[Abstract]. |
| 30. | CROUZY, S. C., AND F. J. SIGWORTH. Fluctuations in ion channel gating currents. Analysis of nonstationary shot noise. Biophys. J. 64: 68-76, 1993[Abstract]. |
| 31. | DEMO, S. D., AND G. YELLEN. The inactivation gate of Shaker K+ channel behaves like an open-channel blocker. Neuron 7: 743-753, 1991[ISI][Medline]. |
| 32. | DOYLE, D. A., J. M. CABRAL, R. A. PFUETZNER, A. KUO, J. M.
GULBIS, S. L. COHEN, B. T. CHAIT, AND R. MacKINNON.
The structure of the potassium channel: molecular basis of K+
conduction and selectivity. Science 280: 69-77, 1998 |
| 33. | DURREL, S. R., AND H. R. GUY. Atomic scale structure and functional models of voltage-gated potassium channels. Biophys. J. 62: 238-250, 1992. |
| 34. | EAHOLTZ, G., T. SCHEUER, AND W. A. CATTERALL. Restoration of inactivation and block of open sodium channels by an inactivation gate peptide. Neuron 12: 1041-1048, 1994[ISI][Medline]. |
| 35. | FORSTER, I. C., AND N. G. GREEFF. The early phase of sodium channel gating current in the squid giant axon. Characteristics of a fast component of displacement charge movement. Eur. Biophys. J. 21: 99-116, 1992[ISI][Medline]. |
| 36. | GOLDMAN, L., AND C. L. SCHAUF. Inactivation of the sodium current in Myxicola giant axon. Evidence of coupling to the activation process. J. Gen. Physiol. 59: 659-675, 1972[Abstract]. |
| 37. | GONZALEZ, C., J. AMIGO, E. ROSENMANN, F. BEZANILLA, O. ALVAREZ, AND R. LATORRE. Role of the S3-S4 linker in the activation of Shaker K+ channels (Abstract). Biophys. J. 76: A78, 1999[ISI]. |
| 38. | HIRSCHBERG, B., A. ROVNER, M. LIEBERMAN, AND J. PATLAK. Transfer of twelve charges is needed to open skeletal muscle Na+ channels. J. Gen. Physiol. 106: 1053-1068, 1996[Abstract]. |
| 39. | HODGKIN, A. L., AND A. F. HUXLEY. A quantitative description of membrane current and its application to conduction and excitation in nerve. J. Physiol. (Lond.) 117: 500-544, 1952[ISI][Medline]. |
| 40. | HOLMGREN, M., M. E. JURMAN, AND G. YELLEN. N-type inactivation and the S4-S5 region of the Shaker K+ channel. J. Gen. Physiol. 108: 195-206, 1996[Abstract]. |
| 41. | HOSHI, T., W. N. ZAGOTTA, AND R. W.
ALDRICH. Biophysical and molecular mechanisms of Shaker potassium
channel inactivation. Science 250: 533-538, 1990 |
| 42. | HOSHI, T., W. N. ZAGOTTA, AND R. W. ALDRICH. Two types of inactivation in Shaker K+ channels: effect of alterations in the carboxy-terminal region. Neuron 7: 547-556, 1991[ISI][Medline]. |
| 43. | HOSHI, T., W. N. ZAGOTTA, AND R. W. ALDRICH. Shaker potassium channel I: transitions near the open state. J. Gen. Physiol. 103: 249-278, 1994[Abstract]. |
| 44. | ISACOFF, E. Y., Y. N. JAN, AND L. Y. JAN. Putative receptor for the cytoplasmic inactivation gate in the Shaker K+ channel. Nature 353: 86-90, 1991[ISI][Medline]. |
| 45. | KEYNES, R. D., AND E. ROJAS. Kinetics and steady-state properties of the charged system controlling sodium conductance in the squid giant axon. J. Physiol (Lond.) 239: 393-434, 1974[ISI][Medline]. |
| 46. | KONTIS, K. J., AND A. L. GOLDIN.
Sodium channel inactivation is altered by substitution of voltage sensor
positive charges. J. Gen. Physiol. 110: 403-413, 1997 |
| 47. | LARSSON, H. P., O. S. BAKER, D. S. DHILLON, AND E. Y. ISACOFF. Transmembrane movement of the Shaker K+ channel S4. Neuron 16: 387-397, 1996[ISI][Medline]. |
| 48. | LEDWELL, J. L., AND R. ALDRICH.
Mutations in the S4 region isolate the final voltage-dependent cooperative
step in potassium channel activation. J. Gen. Physiol. 113: 389-414,
1999 |
| 49. | LEE, C. W. B., R. W. ALDRICH, AND L. M. GIERASH. Conformational studies of the N-terminal domain of the Shaker B K+ channel by CD and NMR (Abstract). Biophys. J. 61: 379a, 1992. |
| 50. | LEVINSON, S. R., AND H. MEVES. The binding of titriated tetrodotoxin to squid giant axons. Philos. Trans. R. Soc. Lond. B Biol. Sci. 270: 349-352, 1975[ISI][Medline]. |
| 51. | LEVITT, D. G. Continuum model of voltage-dependent gating. Macroscopic conductance, gating current and single-channel behavior. Biophys. J. 55: 489-498, 1989[Abstract]. |
| 52. | LIMAN, E. R., AND G. HESS. Voltage-sensing residues in the S4 region of a mammalian K+ channel. Nature 353: 752-756, 1991[ISI][Medline]. |
| 53. | LOOTS, E., AND E. Y. ISACOFF.
Protein rearrangements underlying slow inactivation of the Shaker K+
channel. J. Gen. Physiol. 112: 377-389, 1998 |
| 54. | LOGOTHETIS, D. E., S. MOVAHEDI, C. SATLER, K. LINDPAINTNER, AND B. NADAL-GINARD. Incremental reductions of positive charge within the S4 region of a voltage-gated K+ channel result in corresponding decreases in gating charge. Neuron 8: 531-540, 1992[ISI][Medline]. |
| 55. | LOPEZ-BARNEO, J., T. HOSHI, S. H. HEINEMANN, AND R. W. ALDRICH. Effects of external cations and mutations in the pore region on C-type inactivation of Shaker potassium channels. Receptors Channels 1: 61-71, 1993[ISI][Medline]. |
| 56. | MacKINNON, R., S. L. COHEN, A. KUO, A. LEE,
AND B. T. CHAIT. Structural conservation in prokaryotic and
eukaryotic potassium channels. Science 280: 106-109, 1998 |
| 57. | MacKINNON, R., AND G. YELLEN.
Mutations affecting TEA blockade and ion permeation in voltage-activated K+
channels. Science 250: 276-279, 1990 |
| 58. | MANNUZZU, L. M., M. M. MORONNE, AND E. Y. ISACOFF. Direct physical measure of conformational rearrangement underlying potassium channel gating. Science 271: 213-216, 1996[Abstract]. |
| 59. | McPHEE, J. C., D. S. RAGSDALE, T. SCHEUER,
AND W. A. CATTERALL. A mutation in segment IVS6 disrupts fast
inactivation of sodium channels. Proc. Natl. Acad. Sci. USA 91:
12346-12350, 1994 |
| 60. | MCPHEE, J. C., D. S. RAGSDALE, T. SCHEUER,
AND W. A. CATTERALL. A critical role of the S4-S5 intracellular loop
in domain IV of the sodium channel alpha-subunit in fast inactivation. J.
Biol. Chem. 273: 1121-1129, 1998 |
| 61. | MONKS, S. A., D. J. NEEDLEMAN, AND
C. MILLER. Helical structure and packing orientation of the S2 segment in
the Shaker K+ channel. J. Gen. Physiol. 113:
415-423, 1999 |
| 62. | MURRELL-LAGNADO, R. D., AND R. W. ALDRICH. Interactions of amino terminal domains of Shaker K channels with a pore blocking site studies with synthetic peptides. J. Gen. Physiol. 102: 949-975, 1993[Abstract]. |
| 63. | NEHER, E., AND B. SAKMANN. Single-channel currents recorded from membranes of denervated frog muscle fibres. Nature 260: 799-802, 1976[ISI][Medline]. |
| 64. | NOCETI, F., P. BALDELLI, X. WEI, N. QIN, L. TORO, L. BIRNBAUMER, AND E. STEFANI. Effective gating charges per channel in voltage-dependent K+ and Ca2+ Channel. J. Gen. Physiol. 108: 143-155, 1996[Abstract]. |
| 65. | NODA, M., S. SHIMIZU, T. TANABE, T. TAKAI, T. KAYANO, T. IKEDA, H. TAKAHASHI, H. NAKAYAMA, Y. KANAOKA, AND N. MINAMINO. Primary structure of Electrophorus electricus sodium channel deduced from cDNA sequence. Nature 312: 121-127, 1984[ISI][Medline]. |
| 66. | OLCESE, R., R. LATORRE, L. TORO, F. BEZANILLA,
AND E. STEFANI. Correlation between charge movement
and ionic current during slow inactivation in Shaker K+
channels. J. Gen. Physiol. 110: 579-589, 1997 |
| 67. | OXFORD, G. S. Some kinetic and steady-state properties of sodium channels after removal of inactivation. J. Gen. Physiol. 77: 1-22, 1981[Abstract]. |
| 68. | PAPAZIAN, D. M., AND F. BEZANILLA.
How does a channel sense voltage? News Physiol. Sci. 12: 203-210,
1997 |
| 69. | PAPAZIAN, D. M., X. M. SHAO, S.-A. SEOH, A. F. MOCK, Y. HUANG, AND D. H. WAINSTOCK. Electrostatic interactions of S4 voltage sensor in Shaker K+ channel. Neuron 14: 1293-1301, 1995[ISI][Medline]. |
| 70. | PAPAZIAN, D. M., L. C. TIMPE, Y. N. JAN, AND L. Y. JAN. Alteration of voltage-dependence of Shaker potassium channel by mutations in the S4 sequence. Nature 349: 305-310, 1991[ISI][Medline]. |
| 71. | PEROZO, E., D. M. CORTES, AND L. G. CUELLO. Three-dimensional architecture and gating mechanism of a K+ channel studied by EPR spectroscopy. Nature Struct. Biol. 5: 459-469, 1998[ISI][Medline]. |
| 72. | PEROZO, E., D. M. CORTES, AND L. G.
CUELLO. Structural rearrangements underlying K+ channel
activation gating. Science 285: 73-78, 1999 |
| 73. | PEROZO, E., R. MacKINNON, F. BEZANILLA, AND E. STEFANI. Gating currents from a non-conducting mutant reveal open-closed conformations in Shaker K+ channels. Neuron 11: 353-358, 1993[ISI][Medline]. |
| 74. | PLANELLS-CASES, R., A. V. FERRIER-MONTIEL, C. D. PATTEN,
AND M. MONTAL. Mutation of conserved
negatively-charged residues in the S2 and S3 segments of a mammalian K+
channel selectively modulates gating. Proc. Natl. Acad. Sci. USA 92:
9422-9426, 1995 |
| 75. | RODRIGUEZ, B. M., AND F. BEZANILLA. Transitions near the open state in Shaker K+ channel: probing with temperature. Neuropharmacology 35: 775-785, 1996[ISI][Medline]. |
| 76. | RODRIGUEZ, B. M., D. SIGG, AND F.
BEZANILLA. Voltage gating of Shaker K+ channels. The
effect of temperature on ionic and gating currents. J. Gen. Physiol.
112: 223-242, 1998 |
| 77. | ROUX, M. J., R. OLCESE, L. TORO, F. BEZANILLA,
AND E. STEFANI. Fast inactivation in Shaker K+
channels: properties of ionic and gating currents. J. Gen. Physiol.
111: 625-638, 1998 |
| 78. | SCHNEIDER, M. F., AND W. K. CHANDLER. Voltage dependent charge movement in skeletal muscle: a possible step in excitation-contraction coupling. Nature 242: 244-246, 1973[ISI][Medline]. |
| 79. | SCHOPPA, N. E., K. McCORMACK, M. A. TANOUYE,
AND F. J. SIGWORTH. The size of gating charge in
wild-type and mutant Shaker potassium channels. Science 255:
1712-1715, 1992 |
| 80. | SCHOPPA, N. E., AND F. J. SIGWORTH.
Activation of Shaker potassium channels. III. Kinetics of the V2
mutant channel. J. Gen. Physiol. 111: 295-311, 1998 |
| 81. | SCHOPPA, N. E., AND F. J. SIGWORTH.
Activation of Shaker potassium channels. III. An activation gating
model for wild-type and V2 mutant channel. J. Gen. Physiol. 111:
313-342, 1998 |
| 82. | SELVIN, P. R. Lanthanide-based resonance energy transfer. IEEE J. Selected Top. Quantum Electronics 2: 1077-1087, 1996[ISI]. |
| 83. | SEOH, S.-A., D. SIGG, D. M. PAPAZIAN, AND F. BEZANILLA. Voltage-sensing residues in the S2 and S4 segments of the Shaker K+ channel. Neuron 16: 1159-1167, 1996[ISI][Medline]. |
| 84. | SIGG, D., AND F. BEZANILLA. Total
charge movement per channel: the relation between gating displacement and
the voltage sensitivity of activation. J. Gen. Physiol. 109: 27-39,
1997 |
| 85. | SIGG, D., H. QIAN, AND F. BEZANILLA.
Kramers' diffusion theory applied to gating kinetics of voltage-dependent
channels. Biophys. J. 76: 782-803, 1999 |
| 86. | SIGG, D., E. STEFANI, AND F.
BEZANILLA. Gating current noise produced by elementary transition in
Shaker potassium channels. Science 264: 578-582, 1994 |
| 87. | SIGG, D., E. STEFANI, AND F. BEZANILLA. Quasi equilibrium variance-voltage relationship of gating current fluctuations from Shaker K channels (Abstract). Biophys. J. 76: A266, 1999[ISI]. |
| 88. | SIGWORTH, F. J. The variance of sodium current fluctuations at the node of Ranvier. J. Physiol. (Lond.) 307: 97-129, 1980[ISI][Medline]. |
| 89. | SMITH, M. R., AND A. L. GOLDIN. Interaction between the sodium channel inactivation linker and domain III S4-S5. Biophys. J. 73: 1-11, 1997. |
| 90. | SMITH-MAXWELL, C. J., J. L. LEDWELL, AND
R. W. ALDRICH. Uncharged S4 residues and cooperativity of voltage-dependent
potassium channel activation. J. Gen. Physiol. 111: 421-439, 1998 |
| 91. | SORENSEN, J. B., A. CHA, R. LATORRE, E. ROSENMANN, AND F. BEZANILLA. A deletion in the linker between S3 and S4 in Shaker allows tetramethylrhodamine attached near S4 to track slow inactivation (Abstract). Biophys. J. 76: A411, 1999[ISI]. |
| 92. | STARACE, D., AND F. BEZANILLA. Modification of Shaker potassium channel gating by deuterium oxide (Abstract). Biophys. J. 72: A131, 1997. |
| 93. | STARACE, D., AND F. BEZANILLA. Accessibility studies of Shaker K channel S4 residues by histidine-scanning mutagenesis (Abstract). Biophys. J. 74: A254, 1998[ISI]. |
| 94. | STARACE, D., AND F. BEZANILLA. Histidine at position 362 causes inwardly rectifying H+ conduction in Shaker K+ channel (Abstract). Biophys. J. 76: A266, 1999[ISI]. |
| 95. | STARACE, D. M., E. STEFANI, AND F. BEZANILLA. Voltage-dependent proton transport by the voltage sensor of the Shaker K+ channel. Neuron 19: 1319-1327, 1997[ISI][Medline]. |
| 96. | STEFANI, E., AND F. BEZANILLA. Early events in voltage gating (Abstract). Biophys. J. 70: A143, 1996. |
| 97. | STEFANI, E., AND F. BEZANILLA. Voltage dependence of the early events in voltage gating (Abstract). Biophys. J. 72: A131, 1997. |
| 98. | STEFANI, E., D. SIGG, AND F. BEZANILLA. Gating current fluctuations in normal and slow-inactivated Shaker K channels (Abstract). Biophys. J. 76: A192, 1999[ISI]. |
| 99. | STEFANI, E., L. TORO, E. PEROZO, AND F. BEZANILLA. Gating of Shaker K channels. I. Ionic and gating currents. Biophys. J. 66: 996-1010, 1994[Abstract]. |
| 100. | STUHMER, W., F. CONTI, H. SUZUKI, X. D. WANG, M. NODA, M. YAHAGI, H. KUBO, AND S. NUMA. Structural parts involved in activation and inactivation of the sodium channel. Nature 339: 597-603, 1989[ISI][Medline]. |
| 101. | TANG, L., R. KALLEN, AND R. HORN. Role of the S4-S5 linker in sodium channel inactivation probed by mutagenesis and a peptide blocker. J. Gen. Physiol. 108: 89-104, 1996[Abstract]. |
| 102. | TAYLOR, R. E., AND F. BEZANILLA. Sodium and gating current time shifts resulting from changes in initial conditions. J. Gen. Physiol. 81: 773-784, 1983[Abstract]. |
| 103. | TIWARI-WOODRUFF, S. K., M. A. LIN, AND D. M. PAPAZIAN. Acidic residue E283 in the S2 segment of Shaker K+ channel is accessible from the outside in closed or open channel conformations. Soc. Neurosci. Abstr. 24: 1985, 1998. |
| 104. | TIWARI-WOODRUFF, S. K., C. T. SCHULTEIS, A. F. MOCK, AND D. M. PAPAZIAN. Electrostatic interactions between transmembrane segments mediate folding of Shaker K+ channel subunits. Biophys. J. 72: 1489-1500, 1997[Abstract]. |
| 105. | TORO, L., M. OTTOLIA, E. STEFANI, AND R. LATORRE. Structural determinants in the interaction of Shaker inactivating peptide and the Ca2+-activated K+ channel. Biochemistry 33: 7220-7228, 1994[ISI][Medline]. |
| 106. | TORO, L., E. STEFANI, AND R. LATORRE. Internal blockade of a Ca2+-activated K+ channel by Shaker B inactivating "ball" peptide. Neuron 9: 237-245, 1992[ISI][Medline]. |
| 107. | VANDENBERG, C. A., AND R. HORN. Inactivation viewed through single sodium channels. J. Gen. Physiol. 84: 535-564, 1984[Abstract]. |
| 108. | VANDENBERG, C. A., AND F. BEZANILLA. A sodium channel model of gating based on single channel, macroscopic ionic and gating currents in the squid giant axon. Biophys. J. 60: 1511-1533, 1991[Abstract]. |
| 109. | WEST, J. W., D. E. PATTON, T. SCHEUER, Y. WANG, A. L.
GOLDIN, AND W. A. CATTERALL. A cluster of hydrophobic
amino acid residues required for fast Na+-channel inactivation.
Proc. Natl. Acad. Sci. USA 89: 10910-10914, 1992 |
| 110. | YANG, N., A. L. GEORGE, AND R. HORN. Molecular basis of charge movement in voltage-gated sodium channels. Neuron 16: 113-122, 1996[ISI][Medline]. |
| 111. | YANG, N., A. L. GEORGE, JR., AND R. HORN. Probing the outer vestibule of a sodium channel voltage sensor. Biophys. J. 73: 2260-2268, 1997[Abstract]. |
| 112. | YANG, N., AND R. HORN. Evidence for voltage-dependent S4 movement in sodium channels. Neuron 15: 213-218, 1995[ISI][Medline]. |
| 113. | YANG, N., S. JI, M. ZHOU, L. J. PTACEK, R. L. BARCHI, R.
HORN, AND A. L. GEORGE, JR
Sodium channel mutations in paramyotonia congenita exhibit similar
biophysical phenotypes in vitro. Proc. Natl. Acad. Sci. USA 91:
12785-12789, 1994 |
| 114. | YELLEN, G. The moving parts of voltage-gated ion channels. Q. Rev. Biophys. 31: 239-295, 1998[ISI][Medline]. |
| 115. | YUSAF, S. P., D. WRAY, AND A. SIVAPRASADARAO. Measurement of the movement of the S4 segment during activation of a voltage-gated potassium channel. Pflügers Arch. 433: 91-97, 1996[ISI][Medline]. |
| 116. | ZAGOTTA, W. N., AND R. W. ALDRICH. Voltage-dependent gating of Shaker A-type potassium channels in Drosophila muscle. J. Gen. Physiol. 95: 29-60, 1990[Abstract]. |
| 117. | ZAGOTTA, W. N., T. HOSHI, AND T.
ALDRICH. Restoration of inactivation in mutants of Shaker potassium
channels by a peptide derived from ShB. Science 250: 568-571, 1990 |
| 118. | ZAGOTTA, W. N., T. HOSHI, J. DITTMAN, AND R. W. ALDRICH. Shaker potassium channel gating II: transitions in the activation pathway. J. Gen. Physiol. 103: 279-319, 1994[Abstract]. |
| 119. | ZAGOTTA, W. N., T. HOSHI, J. DITTMAN, AND R. ALDRICH. Shaker potassium channel gating III: evaluation of kinetic models for activation. J. Gen. Physiol. 103: 321-362, 1994[Abstract]. |
| 120. | ZHENG, J., AND F. J. SIGWORTH.
Selectivity changes during activation of mutant Shaker potassium
channels. J. Gen. Physiol. 110: 101-117, 1997 |